Businesses in Bay Roberts
Hotels & Travel
Restaurants
Automotive
Financial Services
Medical
Beauty & Spas
Community & Government
Industries
Business Distribution by Industry Shopping: 20%
Automotive: 9.1%
Medical: 8%
Professional Services: 7.2%
Industry: 6.8%
Home Services: 6.7%
Restaurants: 6.5%
Financial Services: 6.1%
Food: 6%
Other: 23.6%
| Industry Description | Number of Establishments | Average Age of Business | Average Google Rating | Businesses per 1,000 residents |
|---|---|---|---|---|
| Car parts | 9 | 37.6 years | 4.3 | 1.5 |
| Car repair | 19 | 32.9 years | 4.2 | 3.2 |
| Beauty salons | 13 | 25.9 years | 4.1 | 2.2 |
| Hairdressers | 10 | 26.9 years | 4.3 | 1.7 |
| Public administration | 6 | 24.7 years | 5.0 | 1.0 |
| Loan companies | 14 | 26.9 years | 3.8 | 2.4 |
| Grocery stores and supermarkets | 9 | 23.7 years | 4.0 | 1.5 |
| General contractors | 11 | 24.9 years | 4.4 | 1.8 |
| Wholesale of food, beverages and tobacco | 6 | 25 years | 1.0 | |
| Wholesale of machinery | 8 | 27.9 years | 4.2 | 1.3 |
| Wholesalers | 6 | 27 years | 1.0 | |
| Dentists | 5 | 3.0 | 0.8 | |
| Health and medical | 19 | 27.9 years | 3.6 | 3.2 |
| Accountants | 6 | 1.0 | ||
| Churches | 8 | 30.4 years | 4.5 | 1.3 |
| American restaurants | 6 | 4.2 | 1.0 | |
| Cafes | 6 | 4.4 | 1.0 | |
| Department stores | 11 | 26.3 years | 3.7 | 1.8 |
| Hardware stores | 6 | 4.3 | 1.0 | |
| Pharmacies and drug stores | 5 | 23.1 years | 0.8 | |
| Shopping other | 5 | 23.9 years | 0.8 |
| Area of Bay Roberts, Newfoundland and Labrador | 24.9 km² |
| Population | 5,957 |
| Male Population | 2,918 (49%) |
| Female Population | 3,039 (51%) |
| Population change from 1975 to 2015 | +59.5% |
| Population change from 2000 to 2015 | +16.5% |
| Median Age | 42.2 |
| Male Median Age | 41.3 |
| Female Median Age | 43.1 |
| Area Codes | 709 |
| Local Time | Thursday 1:03 AM |
| Timezone | Newfoundland Daylight Time |
| Lat & Lng | 47.59989° / -53.26478° |
| Postal Codes | A0A |
Bay Roberts, Newfoundland and Labrador - Map
Bay Roberts, Newfoundland and Labrador Population
Years 1975 to 2015| Data | 1975 | 1990 | 2000 | 2015 |
|---|---|---|---|---|
| Population | 3,734 | 4,571 | 5,112 | 5,957 |
| Population Density | 149.7 / km² | 183.3 / km² | 205.0 / km² | 238.8 / km² |
Bay Roberts Population change from 2000 to 2015
Increase of 16.5% from year 2000 to 2015| Location | Change since 1975 | Change since 1990 | Change since 2000 |
|---|---|---|---|
| Bay Roberts, Newfoundland and Labrador | +59.5% | +30.3% | +16.5% |
| Newfoundland and Labrador | +14.2% | +7.2% | +4.3% |
| Canada | +55.8% | +30.2% | +17.2% |
Bay Roberts, Newfoundland and Labrador Median Age
Median Age: 42.2 years| Location | Median Age | Median Age (Female) | Median Age (Male) |
|---|---|---|---|
| Bay Roberts, Newfoundland and Labrador | 42.2 years | 43.1 years | 41.3 years |
| Newfoundland and Labrador | 44.5 years | 45 years | 44 years |
| Canada | 40.6 years | 41.5 years | 39.6 years |
Bay Roberts, Newfoundland and Labrador Population Tree
Population By Age and Gender| Age | Male | Female | Total |
|---|---|---|---|
| Under 5 | 169 | 169 | 338 |
| 5-9 | 204 | 169 | 373 |
| 10-14 | 194 | 169 | 364 |
| 15-19 | 179 | 139 | 318 |
| 20-24 | 149 | 144 | 293 |
| 25-29 | 138 | 189 | 328 |
| 30-34 | 179 | 179 | 359 |
| 35-39 | 190 | 210 | 400 |
| 40-44 | 215 | 246 | 461 |
| 45-49 | 235 | 256 | 492 |
| 50-54 | 216 | 216 | 432 |
| 55-59 | 215 | 241 | 456 |
| 60-64 | 220 | 241 | 462 |
| 65-69 | 164 | 174 | 339 |
| 70-74 | 98 | 118 | 216 |
| 75-79 | 87 | 77 | 164 |
| 80-84 | 41 | 51 | 93 |
| 85 Plus | 25 | 51 | 77 |
Bay Roberts, Newfoundland and Labrador Population Density
Population Density: 238.8 / km²| Location | Population | Area | Population Density |
|---|---|---|---|
| Bay Roberts, Newfoundland and Labrador | 5,957 | 24.9 km² | 238.8 / km² |
| Newfoundland and Labrador | 525,566 | 438,810 km² | 1.2 / km² |
| Canada | 35.5 million | 9,875,295.4 km² | 3.6 / km² |
Bay Roberts, Newfoundland and Labrador Historical and Projected Population
Estimated Population from 1820 to 2100Sources:
1. JRC (European Commission's Joint Research Centre) work on the GHS built-up grid
2. CIESIN (Center for International Earth Science Information Network)
3. [Link] Klein Goldewijk, K., Beusen, A., Doelman, J., and Stehfest, E.: Anthropogenic land use estimates for the Holocene – HYDE 3.2, Earth Syst. Sci. Data, 9, 927–953, https://doi.org/10.5194/essd-9-927-2017, 2017.
Business distribution by price for Bay Roberts, Newfoundland and Labrador
Inexpensive: 61.1%
Moderate: 27.8%
Expensive: 5.6%
Very Expensive: 5.6%
Human Development Index (HDI)
Statistic composite index of life expectancy, education, and per capita income.Sources: [Link] Kummu, M., Taka, M. & Guillaume, J. Gridded global datasets for Gross Domestic Product and Human Development Index over 1990–2015. Sci Data 5, 180004 (2018) doi:10.1038/sdata.2018.4
Bay Roberts, Newfoundland and Labrador CO2 Emissions
Carbon Dioxide (CO2) Emissions Per Capita in Tonnes Per Year| Location | CO2 Emissions | CO2 Emissions Per Capita | CO2 Emissions Intensity |
|---|---|---|---|
| Bay Roberts, Newfoundland and Labrador | 64,996 tn | 10.9 tn | 2,605 tons/km² |
| Newfoundland and Labrador | 7,100,917 tn | 13.5 tn | 16.2 tons/km² |
| Canada | 521,999,336 tn | 14.7 tn | 52.9 tons/km² |
Bay Roberts, Newfoundland and Labrador CO2 Emissions
| 2013 CO2 emissions (tonnes/year) | 64,996 tn |
| 2013 CO2 emissions (tonnes/year) per capita | 10.9 tn |
| 2013 CO2 emissions intensity (tonnes/km²/year) | 2,605 tons/km² |
Natural Hazards Risk
Relative risk out of 10| Cyclone | Medium (5) |
* Risk, particularly concerning flood or landslide, may not be for the entire area.
Sources: 1. Dilley, M., R.S. Chen, U. Deichmann, A.L. Lerner-Lam, M. Arnold, J. Agwe, P. Buys, O. Kjekstad, B. Lyon, and G. Yetman. 2005. Natural Disaster Hotspots: A Global Risk Analysis. Washington, D.C.: World Bank. https://doi.org/10.1596/0-8213-5930-4.
2. Center for Hazards and Risk Research - CHRR - Columbia University, Center for International Earth Science Information Network - CIESIN - Columbia University, International Bank for Reconstruction and Development - The World Bank, and United Nations Environment Programme Global Resource Information Database Geneva - UNEP/GRID-Geneva. 2005. Global Cyclone Hazard Frequency and Distribution. Palisades, NY: NASA Socioeconomic Data and Applications Center (SEDAC). https://doi.org/10.7927/H4CZ353K.
Recent Nearby Earthquakes
Magnitude 3.0 and greater| Date | Time | Magnitude | Distance | Depth | Location | Link |
|---|---|---|---|---|---|---|
| 4/28/09 | 6:26 PM | 3.3 | 28.4 km | 18,000 m | Newfoundland, Newfoundland and Labrador, Canada | usgs.gov |

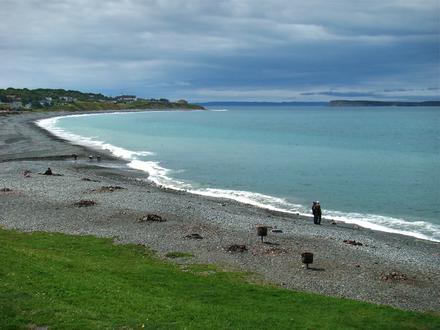
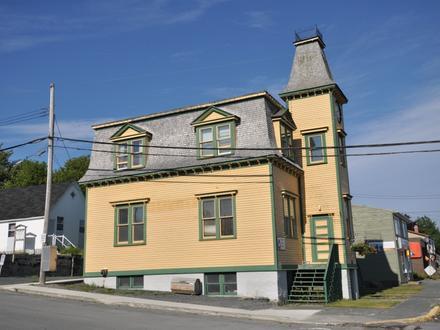
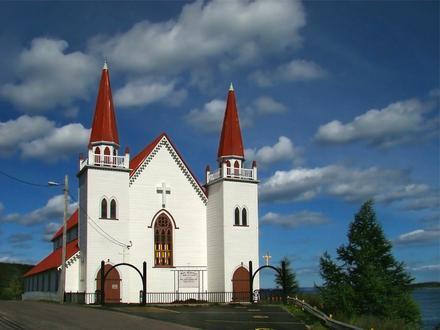
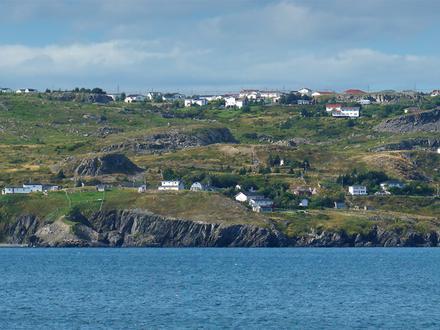
Bay Roberts, Newfoundland and Labrador
Bay Roberts (2011 Population 5,818; UA population 10,871; Census Agglomeration 10,871) is located on the north shore of Conception Bay on the Bay de Verde Peninsula in the province of Newfoundland and Labrador, Canada. The growth of the local economy.. Bay Roberts Wikipedia Page
About Our Data
The data on this page is estimated using a number of publicly available tools and resources. It is provided without warranty, and could contain inaccuracies. Use at your own risk. See here for more information.