Businesses in Belleoram
| Area of Belleoram, Newfoundland and Labrador | 1.353 km² |
| Population | 169 |
| Male Population | 89 (52.4%) |
| Female Population | 80 (47.6%) |
| Population change from 1975 to 2015 | -45.5% |
| Population change from 2000 to 2015 | -20.7% |
| Median Age | 41.9 |
| Male Median Age | 42.5 |
| Female Median Age | 41.2 |
| Area Codes | 709 |
| Local Time | Thursday 1:03 AM |
| Timezone | Newfoundland Daylight Time |
| Lat & Lng | 47.51664° / -55.41501° |
| Postal Codes | A0H |
Belleoram, Newfoundland and Labrador - Map
Belleoram, Newfoundland and Labrador Population
Years 1975 to 2015| Data | 1975 | 1990 | 2000 | 2015 |
|---|---|---|---|---|
| Population | 310 | 243 | 213 | 169 |
| Population Density | 229.1 / km² | 179.6 / km² | 157.4 / km² | 124.9 / km² |
Belleoram Population change from 2000 to 2015
Decrease of 20.7% from year 2000 to 2015| Location | Change since 1975 | Change since 1990 | Change since 2000 |
|---|---|---|---|
| Belleoram, Newfoundland and Labrador | -45.5% | -30.5% | -20.7% |
| Newfoundland and Labrador | +14.2% | +7.2% | +4.3% |
| Canada | +55.8% | +30.2% | +17.2% |
Belleoram, Newfoundland and Labrador Median Age
Median Age: 41.9 years| Location | Median Age | Median Age (Female) | Median Age (Male) |
|---|---|---|---|
| Belleoram, Newfoundland and Labrador | 41.9 years | 41.2 years | 42.5 years |
| Newfoundland and Labrador | 44.5 years | 45 years | 44 years |
| Canada | 40.6 years | 41.5 years | 39.6 years |
Belleoram, Newfoundland and Labrador Population Tree
Population By Age and Gender| Age | Male | Female | Total |
|---|---|---|---|
| Under 5 | 7 | 6 | 13 |
| 5-9 | 7 | 4 | 11 |
| 10-14 | 7 | 4 | 11 |
| 15-19 | 7 | 8 | 15 |
| 20-24 | 2 | 4 | 7 |
| 25-29 | 4 | 4 | 9 |
| 30-34 | 2 | 4 | 7 |
| 35-39 | 4 | 6 | 11 |
| 40-44 | 9 | 8 | 17 |
| 45-49 | 9 | 8 | 17 |
| 50-54 | 9 | 8 | 17 |
| 55-59 | 11 | 4 | 15 |
| 60-64 | 4 | 4 | 9 |
| 65-69 | 2 | 4 | 7 |
| 70-74 | 2 | 2 | 5 |
| 75-79 | 2 | 4 | 7 |
| 80-84 | 0 | 0 | 0 |
| 85 Plus | 0 | 2 | 2 |
Belleoram, Newfoundland and Labrador Population Density
Population Density: 124.9 / km²| Location | Population | Area | Population Density |
|---|---|---|---|
| Belleoram, Newfoundland and Labrador | 169 | 1.353 km² | 124.9 / km² |
| Newfoundland and Labrador | 525,566 | 438,810 km² | 1.2 / km² |
| Canada | 35.5 million | 9,875,295.4 km² | 3.6 / km² |
Belleoram, Newfoundland and Labrador Historical Population
Estimated Population from 1975 to 2015Sources:
1. JRC (European Commission's Joint Research Centre) work on the GHS built-up grid
2. CIESIN (Center for International Earth Science Information Network)
3. [Link] Klein Goldewijk, K., Beusen, A., Doelman, J., and Stehfest, E.: Anthropogenic land use estimates for the Holocene – HYDE 3.2, Earth Syst. Sci. Data, 9, 927–953, https://doi.org/10.5194/essd-9-927-2017, 2017.
Human Development Index (HDI)
Statistic composite index of life expectancy, education, and per capita income.Sources: [Link] Kummu, M., Taka, M. & Guillaume, J. Gridded global datasets for Gross Domestic Product and Human Development Index over 1990–2015. Sci Data 5, 180004 (2018) doi:10.1038/sdata.2018.4
Belleoram, Newfoundland and Labrador CO2 Emissions
Carbon Dioxide (CO2) Emissions Per Capita in Tonnes Per Year| Location | CO2 Emissions | CO2 Emissions Per Capita | CO2 Emissions Intensity |
|---|---|---|---|
| Belleoram, Newfoundland and Labrador | 2,439 tn | 14.4 tn | 1,802 tons/km² |
| Newfoundland and Labrador | 7,100,917 tn | 13.5 tn | 16.2 tons/km² |
| Canada | 521,999,336 tn | 14.7 tn | 52.9 tons/km² |
Belleoram, Newfoundland and Labrador CO2 Emissions
| 2013 CO2 emissions (tonnes/year) | 2,439 tn |
| 2013 CO2 emissions (tonnes/year) per capita | 14.4 tn |
| 2013 CO2 emissions intensity (tonnes/km²/year) | 1,802 tons/km² |
Natural Hazards Risk
Relative risk out of 10| Cyclone | High (8) |
* Risk, particularly concerning flood or landslide, may not be for the entire area.
Sources: 1. Dilley, M., R.S. Chen, U. Deichmann, A.L. Lerner-Lam, M. Arnold, J. Agwe, P. Buys, O. Kjekstad, B. Lyon, and G. Yetman. 2005. Natural Disaster Hotspots: A Global Risk Analysis. Washington, D.C.: World Bank. https://doi.org/10.1596/0-8213-5930-4.
2. Center for Hazards and Risk Research - CHRR - Columbia University, Center for International Earth Science Information Network - CIESIN - Columbia University, International Bank for Reconstruction and Development - The World Bank, and United Nations Environment Programme Global Resource Information Database Geneva - UNEP/GRID-Geneva. 2005. Global Cyclone Hazard Frequency and Distribution. Palisades, NY: NASA Socioeconomic Data and Applications Center (SEDAC). https://doi.org/10.7927/H4CZ353K.
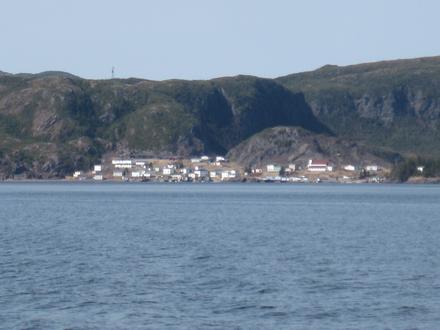
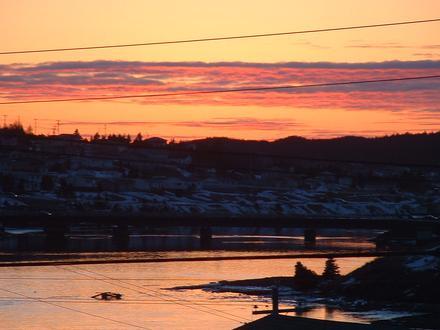
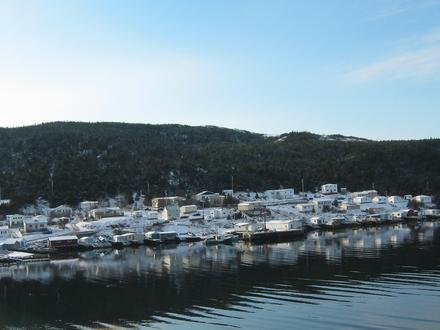
Belleoram, Newfoundland and Labrador
Belleoram is a village on the shores of Fortune Bay in the Canadian province of Newfoundland and Labrador. community sits on a narrow strip of land hemmed in between the bay and steep hills that rise behind it. Belleoram has a large harbour and shel.. Belleoram Wikipedia Page

About Our Data
The data on this page is estimated using a number of publicly available tools and resources. It is provided without warranty, and could contain inaccuracies. Use at your own risk. See here for more information.