- World
- »
- CA
- »
- Ontario
- »
- Callander, Ontario
Businesses in Callander, Ontario
Hotels & Travel
Restaurants
Automotive
Financial Services
Medical
Beauty & Spas
Community & Government
Industries
Business Distribution by Industry Shopping: 17.3%
Home Services: 11.9%
Hotels & Travel: 10%
Industry: 8.5%
Professional Services: 6.9%
Restaurants: 5.6%
Automotive: 5.5%
Other: 34.2%
| Industry Description | Number of Establishments | Average Age of Business | Average Google Rating | Businesses per 1,000 residents |
|---|---|---|---|---|
| General contractors | 15 | 27.6 years | 4.4 | 3.7 |
| Holiday homes, cabins and resorts | 15 | 29.4 years | 4.5 | 3.7 |
| Hotels and motels | 14 | 29.6 years | 4.5 | 3.5 |
| Other accommodation | 27 | 28.7 years | 4.5 | 6.7 |
| Area of Callander, Ontario | 136.1 km² |
| Population | 4,050 |
| Male Population | 2,027 (50.1%) |
| Female Population | 2,023 (49.9%) |
| Population change from 1975 to 2015 | +30.8% |
| Population change from 2000 to 2015 | +8% |
| Median Age | 46 |
| Male Median Age | 45.9 |
| Female Median Age | 46.1 |
| Area Codes | 705 |
| Neighborhoods | Callander, West Ferris |
| Local Time | Wednesday 11:33 PM |
| Timezone | Eastern Daylight Time |
| Lat & Lng | 46.2168° / -79.36632° |
| Postal Codes | P0H, P1B |
Callander, Ontario - Map
Callander, Ontario Population
Years 1975 to 2015| Data | 1975 | 1990 | 2000 | 2015 |
|---|---|---|---|---|
| Population | 3,096 | 3,527 | 3,750 | 4,050 |
| Population Density | 22.7 / km² | 25.9 / km² | 27.5 / km² | 29.8 / km² |
Callander, Ontario Population change from 2000 to 2015
Increase of 8% from year 2000 to 2015| Location | Change since 1975 | Change since 1990 | Change since 2000 |
|---|---|---|---|
| Callander, Ontario | +30.8% | +14.8% | +8% |
| Ontario | +52.6% | +28.6% | +16.4% |
| Canada | +55.8% | +30.2% | +17.2% |
Callander, Ontario Median Age
Median Age: 46 years| Location | Median Age | Median Age (Female) | Median Age (Male) |
|---|---|---|---|
| Callander, Ontario | 46 years | 46.1 years | 45.9 years |
| Ontario | 40.5 years | 41.4 years | 39.6 years |
| Canada | 40.6 years | 41.5 years | 39.6 years |
Callander, Ontario Population Tree
Population By Age and Gender| Age | Male | Female | Total |
|---|---|---|---|
| Under 5 | 94 | 105 | 200 |
| 5-9 | 125 | 100 | 226 |
| 10-14 | 105 | 105 | 210 |
| 15-19 | 105 | 121 | 226 |
| 20-24 | 99 | 79 | 179 |
| 25-29 | 84 | 84 | 168 |
| 30-34 | 89 | 105 | 194 |
| 35-39 | 125 | 136 | 262 |
| 40-44 | 157 | 131 | 288 |
| 45-49 | 172 | 194 | 367 |
| 50-54 | 172 | 194 | 367 |
| 55-59 | 152 | 168 | 320 |
| 60-64 | 193 | 184 | 377 |
| 65-69 | 141 | 121 | 262 |
| 70-74 | 89 | 79 | 168 |
| 75-79 | 68 | 58 | 126 |
| 80-84 | 37 | 32 | 69 |
| 85 Plus | 21 | 27 | 48 |
Callander, Ontario Population Density
Population Density: 29.8 / km²| Location | Population | Area | Population Density |
|---|---|---|---|
| Callander, Ontario | 4,050 | 136.1 km² | 29.8 / km² |
| Ontario | 13.8 million | 1,078,182.8 km² | 12.8 / km² |
| Canada | 35.5 million | 9,875,295.4 km² | 3.6 / km² |
Callander, Ontario Historical and Projected Population
Estimated Population from 1780 to 2100Sources:
1. JRC (European Commission's Joint Research Centre) work on the GHS built-up grid
2. CIESIN (Center for International Earth Science Information Network)
3. [Link] Klein Goldewijk, K., Beusen, A., Doelman, J., and Stehfest, E.: Anthropogenic land use estimates for the Holocene – HYDE 3.2, Earth Syst. Sci. Data, 9, 927–953, https://doi.org/10.5194/essd-9-927-2017, 2017.
Business distribution by price for Callander, Ontario
Inexpensive: 33.3%
Moderate: 33.3%
Expensive: 16.7%
Very Expensive: 16.7%
Human Development Index (HDI)
Statistic composite index of life expectancy, education, and per capita income.Sources: [Link] Kummu, M., Taka, M. & Guillaume, J. Gridded global datasets for Gross Domestic Product and Human Development Index over 1990–2015. Sci Data 5, 180004 (2018) doi:10.1038/sdata.2018.4
Callander, Ontario CO2 Emissions
Carbon Dioxide (CO2) Emissions Per Capita in Tonnes Per Year| Location | CO2 Emissions | CO2 Emissions Per Capita | CO2 Emissions Intensity |
|---|---|---|---|
| Callander, Ontario | 58,136 tn | 14.4 tn | 427.1 tons/km² |
| Ontario | 197,940,137 tn | 14.4 tn | 183.6 tons/km² |
| Canada | 521,999,336 tn | 14.7 tn | 52.9 tons/km² |
Callander, Ontario CO2 Emissions
| 2013 CO2 emissions (tonnes/year) | 58,136 tn |
| 2013 CO2 emissions (tonnes/year) per capita | 14.4 tn |
| 2013 CO2 emissions intensity (tonnes/km²/year) | 427.1 tons/km² |
Natural Hazards Risk
Relative risk out of 10| Earthquake | Low (2) |
* Risk, particularly concerning flood or landslide, may not be for the entire area.
Sources: 1. Dilley, M., R.S. Chen, U. Deichmann, A.L. Lerner-Lam, M. Arnold, J. Agwe, P. Buys, O. Kjekstad, B. Lyon, and G. Yetman. 2005. Natural Disaster Hotspots: A Global Risk Analysis. Washington, D.C.: World Bank. https://doi.org/10.1596/0-8213-5930-4.
2. Center for Hazards and Risk Research - CHRR - Columbia University, Center for International Earth Science Information Network - CIESIN - Columbia University. 2005. Global Earthquake Hazard Distribution - Peak Ground Acceleration. Palisades, NY: NASA Socioeconomic Data and Applications Center (SEDAC). https://doi.org/10.7927/H4BZ63ZS.
Recent Nearby Earthquakes
Magnitude 3.0 and greater| Date | Time | Magnitude | Distance | Depth | Location | Link |
|---|---|---|---|---|---|---|
| 5/2/15 | 1:34 AM | 3.3 | 75.6 km | 18,000 m | 17km NE of Temiscaming, Canada | usgs.gov |
| 1/1/00 | 3:22 AM | 4.7 | 81.8 km | 18,000 m | southern Quebec, Canada | usgs.gov |
| 10/10/95 | 12:19 AM | 3.5 | 51.2 km | 18,000 m | southern Quebec, Canada | usgs.gov |
| 8/12/82 | 6:06 PM | 3.7 | 87.3 km | 18,000 m | southern Quebec, Canada | usgs.gov |
| 12/19/75 | 7:25 AM | 3.8 | 95.6 km | 18,000 m | southern Quebec, Canada | usgs.gov |
| 10/31/35 | 10:03 PM | 5.6 | 76.6 km | 1,000 m | Ontario, Canada | usgs.gov |

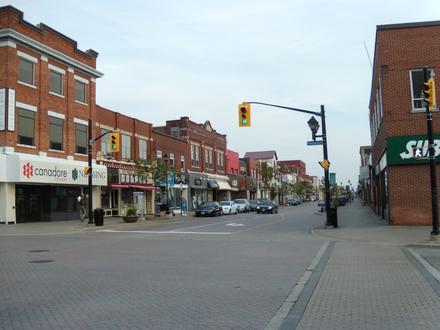
Callander, Ontario
The Municipality of Callander (formerly the Township of North Himsworth) is a township in central Ontario, Canada, located at the southeast end of Lake Nipissing in the Almaguin Highlands region of the District of Parry Sound. The municipality is loc.. Callander, Ontario Wikipedia Page
About Our Data
The data on this page is estimated using a number of publicly available tools and resources. It is provided without warranty, and could contain inaccuracies. Use at your own risk. See here for more information.