Businesses in Change Islands

Industries
Business Distribution by Industry Food: 14%
Hotels & Travel: 14%
Shopping: 11.6%
Education: 11.6%
Religion: 9.3%
Medical: 7%
Restaurants: 4.7%
Entertainment: 4.7%
Home Services: 4.7%
Other: 18.6%
| Area of Change Islands, Newfoundland and Labrador | 5.4 km² |
| Population | 220 |
| Male Population | 108 (49%) |
| Female Population | 112 (51%) |
| Population change from 1975 to 2015 | -29.5% |
| Population change from 2000 to 2015 | -12.4% |
| Median Age | 53.1 |
| Male Median Age | 55 |
| Female Median Age | 51.2 |
| Area Codes | 709 |
| Local Time | Thursday 1:03 AM |
| Timezone | Newfoundland Daylight Time |
| Lat & Lng | 49.66662° / -54.41483° |
| Postal Codes | A0G |
Change Islands, Newfoundland and Labrador - Map
Change Islands, Newfoundland and Labrador Population
Years 1975 to 2015| Data | 1975 | 1990 | 2000 | 2015 |
|---|---|---|---|---|
| Population | 312 | 283 | 251 | 220 |
| Population Density | 57.3 / km² | 51.9 / km² | 46.1 / km² | 40.4 / km² |
Change Islands Population change from 2000 to 2015
Decrease of 12.4% from year 2000 to 2015| Location | Change since 1975 | Change since 1990 | Change since 2000 |
|---|---|---|---|
| Change Islands, Newfoundland and Labrador | -29.5% | -22.3% | -12.4% |
| Newfoundland and Labrador | +14.2% | +7.2% | +4.3% |
Change Islands, Newfoundland and Labrador Median Age
Median Age: 53.1 years| Location | Median Age | Median Age (Female) | Median Age (Male) |
|---|---|---|---|
| Change Islands, Newfoundland and Labrador | 53.1 years | 51.2 years | 55 years |
| Newfoundland and Labrador | 44.5 years | 45 years | 44 years |
Change Islands, Newfoundland and Labrador Population Tree
Population By Age and Gender| Age | Male | Female | Total |
|---|---|---|---|
| Under 5 | 9 | 4 | 14 |
| 5-9 | 9 | 4 | 14 |
| 10-14 | 0 | 9 | 9 |
| 15-19 | 4 | 4 | 9 |
| 20-24 | 0 | 4 | 5 |
| 25-29 | 0 | 4 | 5 |
| 30-34 | 4 | 9 | 14 |
| 35-39 | 4 | 0 | 5 |
| 40-44 | 9 | 4 | 14 |
| 45-49 | 9 | 9 | 18 |
| 50-54 | 4 | 9 | 14 |
| 55-59 | 18 | 9 | 27 |
| 60-64 | 13 | 9 | 23 |
| 65-69 | 9 | 13 | 23 |
| 70-74 | 4 | 9 | 14 |
| 75-79 | 4 | 4 | 9 |
| 80-84 | 4 | 0 | 5 |
| 85 Plus | 0 | 4 | 5 |
Change Islands, Newfoundland and Labrador Population Density
Population Density: 40.4 / km²| Location | Population | Area | Population Density |
|---|---|---|---|
| Change Islands, Newfoundland and Labrador | 220 | 5.4 km² | 40.4 / km² |
| Newfoundland and Labrador | 525,566 | 438,810 km² | 1.2 / km² |
Change Islands, Newfoundland and Labrador Historical and Projected Population
Estimated Population from 1720 to 2100Sources:
1. JRC (European Commission's Joint Research Centre) work on the GHS built-up grid
2. CIESIN (Center for International Earth Science Information Network)
3. [Link] Klein Goldewijk, K., Beusen, A., Doelman, J., and Stehfest, E.: Anthropogenic land use estimates for the Holocene – HYDE 3.2, Earth Syst. Sci. Data, 9, 927–953, https://doi.org/10.5194/essd-9-927-2017, 2017.
Human Development Index (HDI)
Statistic composite index of life expectancy, education, and per capita income.Sources: [Link] Kummu, M., Taka, M. & Guillaume, J. Gridded global datasets for Gross Domestic Product and Human Development Index over 1990–2015. Sci Data 5, 180004 (2018) doi:10.1038/sdata.2018.4

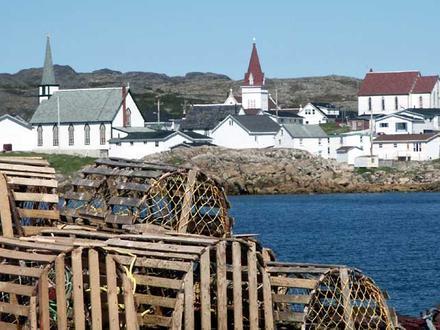
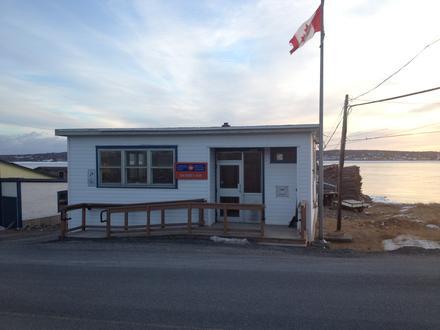
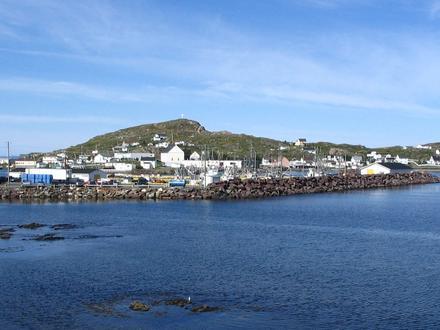
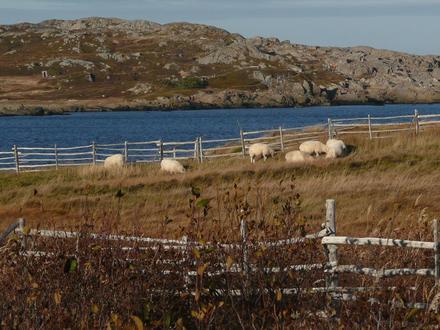
Change Islands, Newfoundland and Labrador
Change Islands is an outport community in the Canadian province of Newfoundland and Labrador. community spans two small islands of the same name which lie off the northeast coast of the island of Newfoundland between Notre Dame Bay and the Labrador .. Change Islands Wikipedia Page
About Our Data
The data on this page is estimated using a number of publicly available tools and resources. It is provided without warranty, and could contain inaccuracies. Use at your own risk. See here for more information.