Businesses in Greenspond
| Area of Greenspond, Newfoundland and Labrador | 2.85 km² |
| Population | 283 |
| Male Population | 144 (50.8%) |
| Female Population | 139 (49.2%) |
| Population change from 1975 to 2015 | -18.4% |
| Population change from 2000 to 2015 | -9.9% |
| Median Age | 49.1 |
| Male Median Age | 49.4 |
| Female Median Age | 48.8 |
| Area Codes | 709 |
| Local Time | Thursday 1:03 AM |
| Timezone | Newfoundland Daylight Time |
| Lat & Lng | 49.06658° / -53.56476° |
| Postal Codes | A0G |
Greenspond, Newfoundland and Labrador - Map
Greenspond, Newfoundland and Labrador Population
Years 1975 to 2015| Data | 1975 | 1990 | 2000 | 2015 |
|---|---|---|---|---|
| Population | 347 | 336 | 314 | 283 |
| Population Density | 121.8 / km² | 117.9 / km² | 110.2 / km² | 99.3 / km² |
Greenspond, Newfoundland and Labrador Population Tree
Population By Age and Gender| Age | Male | Female | Total |
|---|---|---|---|
| Under 5 | 0 | 4 | 5 |
| 5-9 | 5 | 4 | 9 |
| 10-14 | 5 | 8 | 14 |
| 15-19 | 9 | 8 | 18 |
| 20-24 | 9 | 4 | 14 |
| 25-29 | 5 | 8 | 14 |
| 30-34 | 5 | 4 | 9 |
| 35-39 | 9 | 13 | 22 |
| 40-44 | 9 | 8 | 18 |
| 45-49 | 19 | 8 | 27 |
| 50-54 | 14 | 8 | 23 |
| 55-59 | 14 | 17 | 31 |
| 60-64 | 19 | 13 | 32 |
| 65-69 | 5 | 8 | 14 |
| 70-74 | 5 | 8 | 14 |
| 75-79 | 9 | 4 | 14 |
| 80-84 | 0 | 4 | 5 |
| 85 Plus | 5 | 4 | 9 |
Greenspond, Newfoundland and Labrador Historical Population
Estimated Ancient Population until 2015Sources:
1. JRC (European Commission's Joint Research Centre) work on the GHS built-up grid
2. CIESIN (Center for International Earth Science Information Network)
3. [Link] Klein Goldewijk, K., Beusen, A., Doelman, J., and Stehfest, E.: Anthropogenic land use estimates for the Holocene – HYDE 3.2, Earth Syst. Sci. Data, 9, 927–953, https://doi.org/10.5194/essd-9-927-2017, 2017.
Human Development Index (HDI)
Statistic composite index of life expectancy, education, and per capita income.Sources: [Link] Kummu, M., Taka, M. & Guillaume, J. Gridded global datasets for Gross Domestic Product and Human Development Index over 1990–2015. Sci Data 5, 180004 (2018) doi:10.1038/sdata.2018.4
Greenspond, Newfoundland and Labrador CO2 Emissions
| 2013 CO2 emissions (tonnes/year) | 3,063 tn |
| 2013 CO2 emissions (tonnes/year) per capita | 10.8 tn |
| 2013 CO2 emissions intensity (tonnes/km²/year) | 1,075 tons/km² |

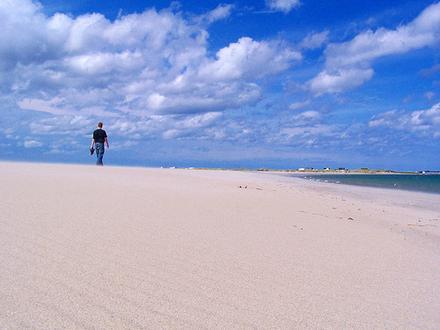
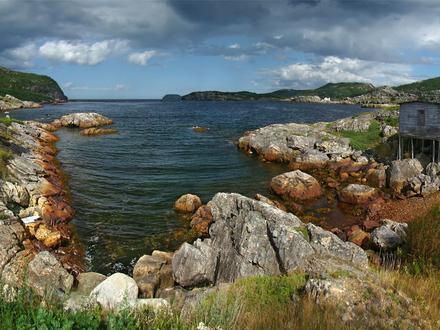
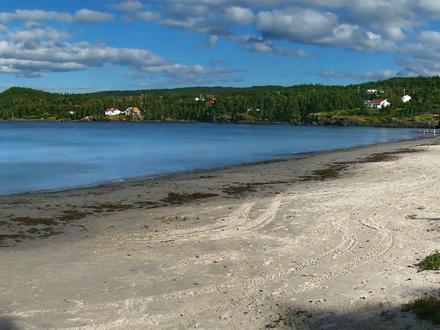
Greenspond, Newfoundland and Labrador
Greenspond is one of the communities that comprise an area on the northeast coast of the Island of Newfoundland, called Bonavista North. These communities have a shared history in that they were settled by people from England, predominantly from the .. Greenspond Wikipedia Page

About Our Data
The data on this page is estimated using a number of publicly available tools and resources. It is provided without warranty, and could contain inaccuracies. Use at your own risk. See here for more information.