- World
- »
- CA
- »
- Ontario
- »
- Windsor, Ontario
Businesses in Windsor, Ontario
Hotels & Travel
Restaurants
Automotive
Financial Services
Medical
Beauty & Spas
Community & Government
Industries
Business Distribution by Industry Shopping: 18.4%
Professional Services: 10.2%
Medical: 9.3%
Industry: 9.2%
Home Services: 8.6%
Restaurants: 7.4%
Automotive: 5.5%
Other: 31.3%
| Industry Description | Number of Establishments | Average Age of Business | Average Google Rating | Businesses per 1,000 residents |
|---|---|---|---|---|
| Car parts | 186 | 34.2 years | 4.2 | 0.9 |
| Car repair | 454 | 30.2 years | 4.2 | 2.1 |
| Beauty salons | 424 | 26.7 years | 4.2 | 2.0 |
| Hairdressers | 407 | 27 years | 4.2 | 1.9 |
| Public administration | 258 | 29.6 years | 3.7 | 1.2 |
| Social work | 219 | 28.5 years | 4.2 | 1.0 |
| Education other | 177 | 28 years | 4.0 | 0.8 |
| Secondary education | 150 | 27.3 years | 4.2 | 0.7 |
| Loan companies | 447 | 27.6 years | 4.2 | 2.1 |
| Convenience stores | 147 | 27.3 years | 4.0 | 0.7 |
| Grocery stores and supermarkets | 258 | 28.3 years | 4.2 | 1.2 |
| Apartments | 144 | 27.7 years | 3.7 | 0.7 |
| General contractors | 504 | 29 years | 3.9 | 2.4 |
| Other construction | 258 | 28.9 years | 4.4 | 1.2 |
| Real estate | 363 | 27.5 years | 4.2 | 1.7 |
| Construction of buildings | 309 | 29.1 years | 4.2 | 1.4 |
| Wholesale of machinery | 300 | 32.7 years | 4.2 | 1.4 |
| Dentists | 226 | 27.4 years | 4.2 | 1.1 |
| Health and medical | 1,228 | 27.4 years | 4.0 | 5.8 |
| Hospitals | 196 | 27.8 years | 3.7 | 0.9 |
| Physicians and surgeons | 209 | 27.9 years | 3.4 | 1.0 |
| Accountants | 151 | 27.5 years | 4.0 | 0.7 |
| Corporate management | 157 | 26.3 years | 3.6 | 0.7 |
| Lawyers legal | 330 | 27.4 years | 4.4 | 1.5 |
| Churches | 244 | 28.3 years | 4.6 | 1.1 |
| Bars, pubs and taverns | 205 | 26.7 years | 4.2 | 1.0 |
| Pizza | 147 | 26.6 years | 4.2 | 0.7 |
| Clothing stores | 271 | 26.9 years | 4.1 | 1.3 |
| Electronics stores | 275 | 28.3 years | 3.9 | 1.3 |
| Hardware stores | 253 | 32.2 years | 4.0 | 1.2 |
| Household appliances and goods | 182 | 29.8 years | 3.9 | 0.9 |
| Office supplies and stationery stores | 147 | 33 years | 4.2 | 0.7 |
| Pharmacies and drug stores | 171 | 27.7 years | 4.3 | 0.8 |
| Shopping other | 398 | 28.5 years | 4.1 | 1.9 |
| Area of Windsor, Ontario | 146.3 km² |
| Population | 213,490 |
| Male Population | 103,638 (48.5%) |
| Female Population | 109,852 (51.5%) |
| Population change from 1975 to 2015 | -6.2% |
| Population change from 2000 to 2015 | -4.7% |
| Median Age | 40.2 |
| Male Median Age | 39.2 |
| Female Median Age | 41.1 |
| Area Codes | 519, 780 |
| Neighborhoods | City Centre, Devonshire Heights, East Windsor, Fontainbleu, Forest Glade, Remington Park, Riverside, Roseland, Sandwich, South Central, South Walkerville, South Windsor, University, Walker Farm, Walkerville |
| Local Time | Tuesday 1:49 AM |
| Timezone | Eastern Daylight Time |
| Facebook Profile | |
| Lat & Lng | 42.30008° / -83.01654° |
| Postal Codes | N8N, N8P, N8R, N8S, N8T, More |
Windsor, Ontario - Map
Windsor, Ontario Population
Years 1975 to 2015| Data | 1975 | 1990 | 2000 | 2015 |
|---|---|---|---|---|
| Population | 227,488 | 228,556 | 223,982 | 213,490 |
| Population Density | 1,554 / km² | 1,562 / km² | 1,530 / km² | 1,459 / km² |
Windsor, Ontario Population change from 2000 to 2015
Decrease of 4.7% from year 2000 to 2015| Location | Change since 1975 | Change since 1990 | Change since 2000 |
|---|---|---|---|
| Windsor, Ontario | -6.2% | -6.6% | -4.7% |
| Ontario | +52.6% | +28.6% | +16.4% |
| Canada | +55.8% | +30.2% | +17.2% |
Windsor, Ontario Median Age
Median Age: 40.2 years| Location | Median Age | Median Age (Female) | Median Age (Male) |
|---|---|---|---|
| Windsor, Ontario | 40.2 years | 41.1 years | 39.2 years |
| Ontario | 40.5 years | 41.4 years | 39.6 years |
| Canada | 40.6 years | 41.5 years | 39.6 years |
Windsor, Ontario Population Tree
Population By Age and Gender| Age | Male | Female | Total |
|---|---|---|---|
| Under 5 | 6,146 | 5,824 | 11,970 |
| 5-9 | 6,229 | 5,900 | 12,130 |
| 10-14 | 6,493 | 6,134 | 12,628 |
| 15-19 | 7,212 | 6,887 | 14,099 |
| 20-24 | 7,492 | 7,300 | 14,792 |
| 25-29 | 6,365 | 7,071 | 13,436 |
| 30-34 | 6,242 | 6,905 | 13,147 |
| 35-39 | 6,714 | 7,312 | 14,027 |
| 40-44 | 7,431 | 7,578 | 15,010 |
| 45-49 | 8,176 | 8,215 | 16,391 |
| 50-54 | 7,907 | 7,968 | 15,875 |
| 55-59 | 6,759 | 7,117 | 13,876 |
| 60-64 | 6,011 | 6,571 | 12,583 |
| 65-69 | 4,475 | 4,916 | 9,392 |
| 70-74 | 3,533 | 4,264 | 7,797 |
| 75-79 | 2,832 | 3,601 | 6,434 |
| 80-84 | 2,094 | 3,083 | 5,177 |
| 85 Plus | 1,527 | 3,206 | 4,733 |
Windsor, Ontario Population Density
Population Density: 1,459 / km²| Location | Population | Area | Population Density |
|---|---|---|---|
| Windsor, Ontario | 213,490 | 146.3 km² | 1,459 / km² |
| Ontario | 13.8 million | 1,078,182.8 km² | 12.8 / km² |
| Canada | 35.5 million | 9,875,295.4 km² | 3.6 / km² |
Windsor, Ontario Historical Population
Estimated Population from 1830 to 2015Sources:
1. JRC (European Commission's Joint Research Centre) work on the GHS built-up grid
2. CIESIN (Center for International Earth Science Information Network)
3. [Link] Klein Goldewijk, K., Beusen, A., Doelman, J., and Stehfest, E.: Anthropogenic land use estimates for the Holocene – HYDE 3.2, Earth Syst. Sci. Data, 9, 927–953, https://doi.org/10.5194/essd-9-927-2017, 2017.
Neighborhoods
Business Distribution by neighborhood in Windsor, Ontario Walkerville: 12.3%
City Centre: 12.1%
Devonshire Heights: 8.2%
Forest Glade: 7.7%
University: 6.8%
East Windsor: 6.6%
Remington Park: 6.4%
South Central: 5.8%
Riverside: 5.5%
Other: 28.7%
Business distribution by price for Windsor, Ontario
Inexpensive: 43.3%
Moderate: 38.1%
Very Expensive: 10.7%
Expensive: 8%
Human Development Index (HDI)
Statistic composite index of life expectancy, education, and per capita income.Sources: [Link] Kummu, M., Taka, M. & Guillaume, J. Gridded global datasets for Gross Domestic Product and Human Development Index over 1990–2015. Sci Data 5, 180004 (2018) doi:10.1038/sdata.2018.4
Windsor, Ontario CO2 Emissions
Carbon Dioxide (CO2) Emissions Per Capita in Tonnes Per Year| Location | CO2 Emissions | CO2 Emissions Per Capita | CO2 Emissions Intensity |
|---|---|---|---|
| Windsor, Ontario | 3,186,231 tn | 14.9 tn | 21,775 tons/km² |
| Ontario | 197,940,137 tn | 14.4 tn | 183.6 tons/km² |
| Canada | 521,999,336 tn | 14.7 tn | 52.9 tons/km² |
Windsor, Ontario CO2 Emissions
| 2013 CO2 emissions (tonnes/year) | 3,186,231 tn |
| 2013 CO2 emissions (tonnes/year) per capita | 14.9 tn |
| 2013 CO2 emissions intensity (tonnes/km²/year) | 21,775 tons/km² |
Natural Hazards Risk
Relative risk out of 10| Flood | High (7) |
* Risk, particularly concerning flood or landslide, may not be for the entire area.
Sources: 1. Dilley, M., R.S. Chen, U. Deichmann, A.L. Lerner-Lam, M. Arnold, J. Agwe, P. Buys, O. Kjekstad, B. Lyon, and G. Yetman. 2005. Natural Disaster Hotspots: A Global Risk Analysis. Washington, D.C.: World Bank. https://doi.org/10.1596/0-8213-5930-4.
2. Center for Hazards and Risk Research - CHRR - Columbia University, Center for International Earth Science Information Network - CIESIN - Columbia University. 2005. Global Flood Hazard Frequency and Distribution. Palisades, NY: NASA Socioeconomic Data and Applications Center (SEDAC). https://doi.org/10.7927/H4668B3D.
Recent Nearby Earthquakes
Magnitude 3.0 and greater
Windsor, Ontario
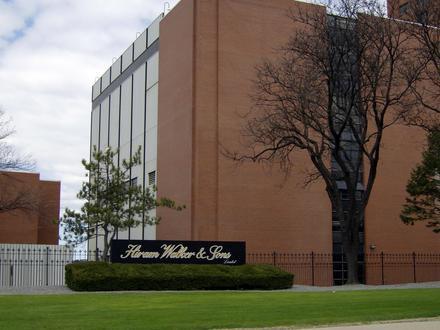
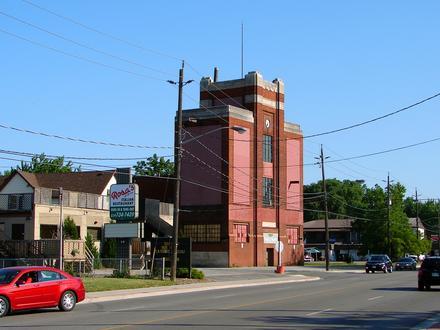
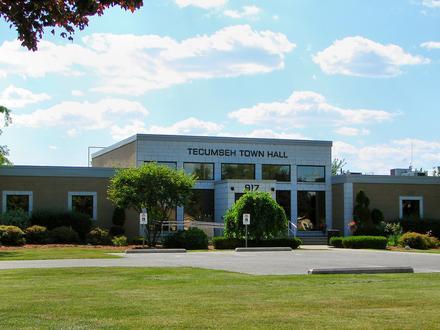
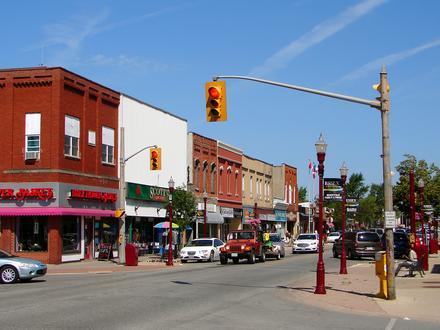
Windsor (/ˈwɪnzər/), Ontario is the southernmost city in Canada. It is located on the southern shore of the Detroit River, directly across the river from Detroit, Michigan. Windsor is a major contributor to Canada's automotive industry and has much t.. Windsor, Ontario Wikipedia Page
Postal Codes
Percentage of businesses by Postal Codes in Windsor, Ontario Postal Code N9A: 16.8%
Postal Code N8X: 15.8%
Postal Code N8W: 12.5%
Postal Code N8T: 7%
Postal Code N8Y: 6.9%
Postal Code N8N: 6.8%
Other: 34.1%
About Our Data
The data on this page is estimated using a number of publicly available tools and resources. It is provided without warranty, and could contain inaccuracies. Use at your own risk. See here for more information.