Businesses in Winnipeg Beach
Hotels & Travel
Restaurants
Automotive
Financial Services
Medical
Beauty & Spas
Community & Government
Industries
Business Distribution by Industry Shopping: 15.5%
Restaurants: 14.8%
Home Services: 10.5%
Hotels & Travel: 7.5%
Food: 6.5%
Sports & Activities: 6.3%
Industry: 5.5%
Professional Services: 5.5%
Automotive: 5.3%
Other: 22.6%
| Area of Winnipeg Beach, Manitoba | 4.01 km² |
| Population | 889 |
| Male Population | 436 (49%) |
| Female Population | 453 (51%) |
| Population change from 1975 to 2015 | -9.1% |
| Population change from 2000 to 2015 | -5.3% |
| Median Age | 58 |
| Male Median Age | 56.8 |
| Female Median Age | 59.1 |
| Area Codes | 204 |
| Local Time | Thursday 4:59 AM |
| Timezone | Central Daylight Time |
| Lat & Lng | 50.49972° / -96.97535° |
| Postal Codes | R0C |
Winnipeg Beach, Manitoba - Map
Winnipeg Beach, Manitoba Population
Years 1975 to 2015| Data | 1975 | 1990 | 2000 | 2015 |
|---|---|---|---|---|
| Population | 978 | 971 | 939 | 889 |
| Population Density | 243.9 / km² | 242.1 / km² | 234.2 / km² | 221.7 / km² |
Winnipeg Beach Population change from 2000 to 2015
Decrease of 5.3% from year 2000 to 2015| Location | Change since 1975 | Change since 1990 | Change since 2000 |
|---|---|---|---|
| Winnipeg Beach, Manitoba | -9.1% | -8.4% | -5.3% |
| Manitoba | +49.8% | +26.3% | +14.9% |
| Canada | +55.8% | +30.2% | +17.2% |
Winnipeg Beach, Manitoba Median Age
Median Age: 58 years| Location | Median Age | Median Age (Female) | Median Age (Male) |
|---|---|---|---|
| Winnipeg Beach, Manitoba | 58 years | 59.1 years | 56.8 years |
| Manitoba | 38.2 years | 39.3 years | 37.1 years |
| Canada | 40.6 years | 41.5 years | 39.6 years |
Winnipeg Beach, Manitoba Population Tree
Population By Age and Gender| Age | Male | Female | Total |
|---|---|---|---|
| Under 5 | 9 | 13 | 22 |
| 5-9 | 18 | 9 | 27 |
| 10-14 | 9 | 9 | 18 |
| 15-19 | 27 | 13 | 40 |
| 20-24 | 13 | 9 | 23 |
| 25-29 | 13 | 17 | 31 |
| 30-34 | 18 | 13 | 31 |
| 35-39 | 13 | 9 | 23 |
| 40-44 | 22 | 22 | 44 |
| 45-49 | 27 | 26 | 53 |
| 50-54 | 31 | 39 | 70 |
| 55-59 | 49 | 60 | 110 |
| 60-64 | 58 | 65 | 123 |
| 65-69 | 44 | 43 | 88 |
| 70-74 | 27 | 43 | 70 |
| 75-79 | 31 | 22 | 53 |
| 80-84 | 22 | 22 | 44 |
| 85 Plus | 5 | 22 | 27 |
Winnipeg Beach, Manitoba Population Density
Population Density: 221.7 / km²| Location | Population | Area | Population Density |
|---|---|---|---|
| Winnipeg Beach, Manitoba | 889 | 4.01 km² | 221.7 / km² |
| Manitoba | 1.3 million | 649,857.2 km² | 1.98 / km² |
| Canada | 35.5 million | 9,875,295.4 km² | 3.6 / km² |
Human Development Index (HDI)
Statistic composite index of life expectancy, education, and per capita income.Sources: [Link] Kummu, M., Taka, M. & Guillaume, J. Gridded global datasets for Gross Domestic Product and Human Development Index over 1990–2015. Sci Data 5, 180004 (2018) doi:10.1038/sdata.2018.4
Winnipeg Beach, Manitoba CO2 Emissions
Carbon Dioxide (CO2) Emissions Per Capita in Tonnes Per Year| Location | CO2 Emissions | CO2 Emissions Per Capita | CO2 Emissions Intensity |
|---|---|---|---|
| Winnipeg Beach, Manitoba | 12,129 tn | 13.6 tn | 3,024 tons/km² |
| Manitoba | 16,464,729 tn | 12.8 tn | 25.3 tons/km² |
| Canada | 521,999,336 tn | 14.7 tn | 52.9 tons/km² |
Winnipeg Beach, Manitoba CO2 Emissions
| 2013 CO2 emissions (tonnes/year) | 12,129 tn |
| 2013 CO2 emissions (tonnes/year) per capita | 13.6 tn |
| 2013 CO2 emissions intensity (tonnes/km²/year) | 3,024 tons/km² |
Natural Hazards Risk
Relative risk out of 10| Drought | Medium (4) |
* Risk, particularly concerning flood or landslide, may not be for the entire area.
Sources: 1. Dilley, M., R.S. Chen, U. Deichmann, A.L. Lerner-Lam, M. Arnold, J. Agwe, P. Buys, O. Kjekstad, B. Lyon, and G. Yetman. 2005. Natural Disaster Hotspots: A Global Risk Analysis. Washington, D.C.: World Bank. https://doi.org/10.1596/0-8213-5930-4.
2. Center for Hazards and Risk Research - CHRR - Columbia University, Center for International Earth Science Information Network - CIESIN - Columbia University, and International Research Institute for Climate and Society - IRI - Columbia University. 2005. Global Drought Hazard Frequency and Distribution. Palisades, NY: NASA Socioeconomic Data and Applications Center (SEDAC). https://doi.org/10.7927/H4VX0DFT.

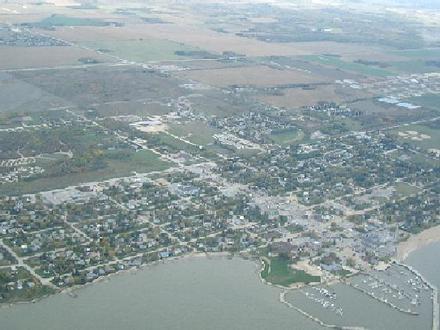
Winnipeg Beach, Manitoba
Winnipeg Beach is a town in the Interlake Region, in the Canadian province of Manitoba. The town was founded in 1900 by Sir William Whyte and is located at the junction of Highway 9 and Highway 229 on the southwestern shore of Lake Winnipeg, about 56.. Winnipeg Beach Wikipedia Page
About Our Data
The data on this page is estimated using a number of publicly available tools and resources. It is provided without warranty, and could contain inaccuracies. Use at your own risk. See here for more information.