Businesses in Tomé
Hotels & Travel
Restaurants
Automotive
Financial Services
Medical
Beauty & Spas
Community & Government
Industries
Business Distribution by Industry Restaurants: 23.1%
Hotels & Travel: 12.2%
Shopping: 12%
Food: 8.9%
Industry: 5.2%
Education: 5.1%
Medical: 5%
Sports & Activities: 4.9%
Other: 23.5%
| Industry Description | Number of Establishments | Average Google Rating | Businesses per 1,000 residents |
|---|---|---|---|
| Beauty salons | 7 | 0.2 | |
| Manicures and pedicures | 8 | 0.2 | |
| Public administration | 16 | 3.6 | 0.4 |
| Primary and elementary schools | 8 | 4.7 | 0.2 |
| Creative arts | 8 | 0.2 | |
| Bakeries | 13 | 4.3 | 0.3 |
| Grocery stores and supermarkets | 9 | 3.8 | 0.2 |
| Construction of houses | 15 | 0.3 | |
| Real estate | 16 | 0.4 | |
| Buses and trains | 12 | 0.3 | |
| Campgrounds | 7 | 4.3 | 0.2 |
| Construction of buildings | 10 | 0.2 | |
| Hospitals | 8 | 2.7 | 0.2 |
| Churches | 17 | 4.4 | 0.4 |
| American restaurants | 10 | 0.2 | |
| Bars, pubs and taverns | 32 | 0.7 | |
| Dance clubs and discotheques | 8 | 0.2 | |
| Fast food restaurants | 15 | 4.6 | 0.3 |
| Seafood restaurants | 30 | 4.1 | 0.7 |
| Clothing stores | 7 | 4.4 | 0.2 |
| Office supplies and stationery stores | 8 | 0.2 | |
| Pharmacies and drug stores | 8 | 4.2 | 0.2 |
| Area of Tomé, Bío Bío Region | 494.5 km² |
| Population | 44,344 |
| Male Population | 21,366 (48.2%) |
| Female Population | 22,978 (51.8%) |
| Population change from 1975 to 2015 | +50.3% |
| Population change from 2000 to 2015 | +1.7% |
| Median Age | 32.6 |
| Male Median Age | 31.2 |
| Female Median Age | 33.9 |
| Area Codes | 41 |
| Local Time | Wednesday 11:33 PM |
| Timezone | Chile Standard Time |
| Lat & Lng | -36.61756° / -72.95593° |
| Postal Codes | 4160000 |
Tomé, Bío Bío Region - Map
Tomé, Bío Bío Region Population
Years 1975 to 2015| Data | 1975 | 1990 | 2000 | 2015 |
|---|---|---|---|---|
| Population | 29,494 | 37,201 | 43,617 | 44,344 |
| Population Density | 59.6 / km² | 75.2 / km² | 88.2 / km² | 89.7 / km² |
Tomé Population change from 2000 to 2015
Increase of 1.7% from year 2000 to 2015| Location | Change since 1975 | Change since 1990 | Change since 2000 |
|---|---|---|---|
| Tomé, Bío Bío Region | +50.3% | +19.2% | +1.7% |
| Del Bio-Bio | +65.3% | +26.4% | +10.4% |
| Chile | +72.2% | +36.6% | +18.3% |
Tomé, Bío Bío Region Median Age
Median Age: 32.6 years| Location | Median Age | Median Age (Female) | Median Age (Male) |
|---|---|---|---|
| Tomé, Bío Bío Region | 32.6 years | 33.9 years | 31.2 years |
| Del Bio-Bio | 31.5 years | 32.2 years | 30.8 years |
| Chile | 31.3 years | 32 years | 30.6 years |
Tomé, Bío Bío Region Population Tree
Population By Age and Gender| Age | Male | Female | Total |
|---|---|---|---|
| Under 5 | 1,552 | 1,494 | 3,046 |
| 5-9 | 1,595 | 1,541 | 3,137 |
| 10-14 | 1,856 | 1,755 | 3,611 |
| 15-19 | 1,991 | 1,956 | 3,947 |
| 20-24 | 1,776 | 1,947 | 3,723 |
| 25-29 | 1,597 | 1,636 | 3,233 |
| 30-34 | 1,357 | 1,501 | 2,858 |
| 35-39 | 1,496 | 1,577 | 3,074 |
| 40-44 | 1,600 | 1,776 | 3,377 |
| 45-49 | 1,555 | 1,687 | 3,243 |
| 50-54 | 1,413 | 1,521 | 2,934 |
| 55-59 | 1,023 | 1,216 | 2,240 |
| 60-64 | 907 | 1,116 | 2,024 |
| 65-69 | 743 | 972 | 1,715 |
| 70-74 | 530 | 729 | 1,260 |
| 75-79 | 376 | 554 | 931 |
| 80-84 | 0 | 0 | 0 |
| 85 Plus | 0 | 0 | 0 |
Tomé, Bío Bío Region Population Density
Population Density: 89.7 / km²| Location | Population | Area | Population Density |
|---|---|---|---|
| Tomé, Bío Bío Region | 44,344 | 494.5 km² | 89.7 / km² |
| Del Bio-Bio | 2.0 million | 37,076.2 km² | 55.2 / km² |
| Chile | 17.8 million | 751,744.8 km² | 23.7 / km² |
Tomé, Bío Bío Region Historical and Projected Population
Estimated Population from 1810 to 2100Sources:
1. JRC (European Commission's Joint Research Centre) work on the GHS built-up grid
2. CIESIN (Center for International Earth Science Information Network)
3. [Link] Klein Goldewijk, K., Beusen, A., Doelman, J., and Stehfest, E.: Anthropogenic land use estimates for the Holocene – HYDE 3.2, Earth Syst. Sci. Data, 9, 927–953, https://doi.org/10.5194/essd-9-927-2017, 2017.
Business distribution by price for Tomé, Bío Bío Region
Inexpensive: 39.4%
Moderate: 30.6%
Expensive: 28.9%
Very Expensive: 1.1%
Human Development Index (HDI)
Statistic composite index of life expectancy, education, and per capita income.Sources: [Link] Kummu, M., Taka, M. & Guillaume, J. Gridded global datasets for Gross Domestic Product and Human Development Index over 1990–2015. Sci Data 5, 180004 (2018) doi:10.1038/sdata.2018.4
Tomé, Bío Bío Region CO2 Emissions
Carbon Dioxide (CO2) Emissions Per Capita in Tonnes Per Year| Location | CO2 Emissions | CO2 Emissions Per Capita | CO2 Emissions Intensity |
|---|---|---|---|
| Tomé, Bío Bío Region | 122,996 tn | 2.77 tn | 248.7 tons/km² |
| Del Bio-Bio | 8,988,188 tn | 4.39 tn | 242.4 tons/km² |
| Chile | 87,296,657 tn | 4.91 tn | 116.1 tons/km² |
Tomé, Bío Bío Region CO2 Emissions
| 2013 CO2 emissions (tonnes/year) | 122,996 tn |
| 2013 CO2 emissions (tonnes/year) per capita | 2.77 tn |
| 2013 CO2 emissions intensity (tonnes/km²/year) | 248.7 tons/km² |
Natural Hazards Risk
Relative risk out of 10| Drought | High (9) |
| Earthquake | High (7.2) |
* Risk, particularly concerning flood or landslide, may not be for the entire area.
Sources: 1. Dilley, M., R.S. Chen, U. Deichmann, A.L. Lerner-Lam, M. Arnold, J. Agwe, P. Buys, O. Kjekstad, B. Lyon, and G. Yetman. 2005. Natural Disaster Hotspots: A Global Risk Analysis. Washington, D.C.: World Bank. https://doi.org/10.1596/0-8213-5930-4.
2. Center for Hazards and Risk Research - CHRR - Columbia University, Center for International Earth Science Information Network - CIESIN - Columbia University, and International Research Institute for Climate and Society - IRI - Columbia University. 2005. Global Drought Hazard Frequency and Distribution. Palisades, NY: NASA Socioeconomic Data and Applications Center (SEDAC). https://doi.org/10.7927/H4VX0DFT.
3. Center for Hazards and Risk Research - CHRR - Columbia University, Center for International Earth Science Information Network - CIESIN - Columbia University. 2005. Global Earthquake Hazard Distribution - Peak Ground Acceleration. Palisades, NY: NASA Socioeconomic Data and Applications Center (SEDAC). https://doi.org/10.7927/H4BZ63ZS.
Recent Nearby Earthquakes
Magnitude 3.0 and greater| Date | Time | Magnitude | Distance | Depth | Location | Link |
|---|---|---|---|---|---|---|
| 5/14/11 | 10:01 PM | 4.5 | 6.8 km | 40,300 m | Bio-Bio, Chile | usgs.gov |
| 2/11/11 | 12:05 PM | 6.9 | 21.7 km | 26,000 m | offshore Bio-Bio, Chile | usgs.gov |
| 9/23/10 | 12:20 AM | 4.4 | 13.2 km | 33,200 m | Bio-Bio, Chile | usgs.gov |
| 9/3/10 | 4:42 PM | 4.4 | 20 km | 39,600 m | offshore Bio-Bio, Chile | usgs.gov |
| 8/1/10 | 11:59 PM | 4.6 | 4.2 km | 32,500 m | Bio-Bio, Chile | usgs.gov |
| 7/14/10 | 10:34 PM | 4.4 | 12.3 km | 30,300 m | offshore Bio-Bio, Chile | usgs.gov |
| 6/5/10 | 5:46 PM | 4.3 | 13.5 km | 26,600 m | offshore Bio-Bio, Chile | usgs.gov |
| 5/17/10 | 2:16 PM | 4.9 | 5.7 km | 35,000 m | Bio-Bio, Chile | usgs.gov |
| 4/15/10 | 5:12 AM | 4.6 | 8.6 km | 37,600 m | Bio-Bio, Chile | usgs.gov |
| 4/10/10 | 6:34 AM | 4.7 | 3.5 km | 35,000 m | offshore Bio-Bio, Chile | usgs.gov |
Find historical earthquake occurrences near Tomé, Bío Bío Region
Earliest Date Latest Date
Magnitude 3.0 and greater Magnitude 4.0 and greater Magnitude 5.0 and greater

Tomé, Bío Bío Region
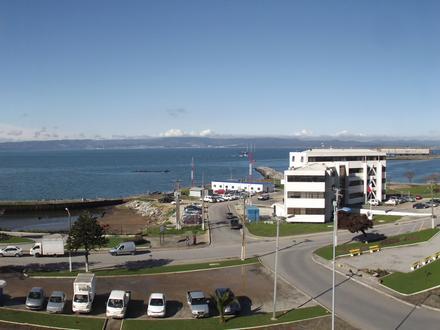
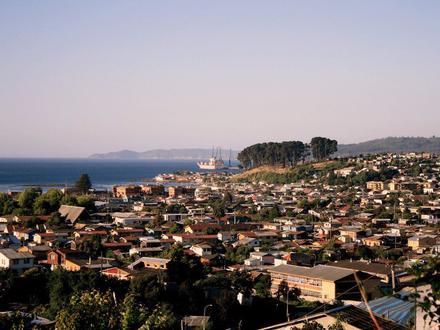
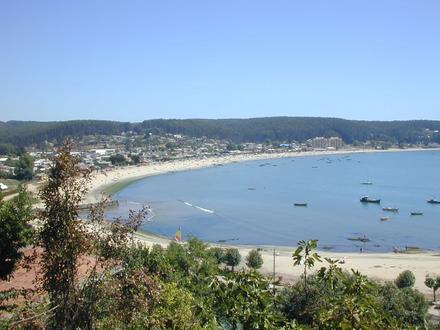
Tomé is a port city and commune in the Biobío Region of Chile. It is bordered by Coelemu to the north, Ránquil and Florida to the east, Penco to the south, and the Pacific Ocean to the west. The local economy is based mainly on textile manufacturing .. Tomé Wikipedia Page
About Our Data
The data on this page is estimated using a number of publicly available tools and resources. It is provided without warranty, and could contain inaccuracies. Use at your own risk. See here for more information.