Businesses in Überlingen
Hotels & Travel
Restaurants
Automotive
Financial Services
Medical
Beauty & Spas
Community & Government
Industries
Business Distribution by Industry Shopping: 16.8%
Professional Services: 14.9%
Medical: 13.9%
Hotels & Travel: 9%
Home Services: 6.8%
Industry: 6.6%
Restaurants: 5.6%
Other: 26.4%
| Industry Description | Number of Establishments | Average Google Rating | Businesses per 1,000 residents |
|---|---|---|---|
| Car repair | 25 | 4.0 | 1.8 |
| Beauty salons | 43 | 4.6 | 3.1 |
| Hairdressers | 32 | 4.2 | 2.3 |
| Banks | 24 | 4.2 | 1.7 |
| Loan companies | 56 | 4.3 | 4.0 |
| Grocery stores and supermarkets | 45 | 4.2 | 3.2 |
| General contractors | 34 | 4.0 | 2.4 |
| Real estate | 70 | 4.6 | 5.0 |
| Hotels and motels | 43 | 4.2 | 3.1 |
| Other accommodation | 126 | 4.2 | 9.1 |
| Travel agencies | 24 | 4.2 | 1.7 |
| Other membership organizations | 29 | 4.5 | 2.1 |
| Alternative medicine | 37 | 4.4 | 2.7 |
| Dentists | 31 | 4.8 | 2.2 |
| Health and medical | 310 | 4.1 | 22.3 |
| Psychiatrists and psychotherapists | 30 | 3.7 | 2.2 |
| Accountants | 24 | 5.0 | 1.7 |
| Architects | 54 | 4.9 | 3.9 |
| Corporate management | 24 | 4.2 | 1.7 |
| Lawyers legal | 27 | 4.5 | 1.9 |
| Technical construction services | 25 | 4.7 | 1.8 |
| Cafes | 28 | 4.3 | 2.0 |
| Clothing stores | 51 | 4.5 | 3.7 |
| Electronics stores | 44 | 4.1 | 3.2 |
| Household appliances and goods | 27 | 4.1 | 1.9 |
| Area of Überlingen, Baden-Württemberg | 5.9 km² |
| Population | 13,898 |
| Male Population | 6,383 (45.9%) |
| Female Population | 7,515 (54.1%) |
| Population change from 1975 to 2015 | +7.7% |
| Population change from 2000 to 2015 | -2% |
| Median Age | 44.8 |
| Male Median Age | 43.7 |
| Female Median Age | 45.8 |
| Area Codes | 7551, 7553, 7554, 7773 |
| Neighborhoods | Andelshofen, Bambergen, Bonndorf, Deisendorf, Goldbach, Lippertsreute, Nesselwangen, Nußdorf |
| Local Time | Friday 3:00 AM |
| Timezone | Central European Summer Time |
| Lat & Lng | 47.76977° / 9.17136° |
| Postal Codes | 88662 |
Überlingen, Baden-Württemberg - Map
Überlingen, Baden-Württemberg Population
Years 1975 to 2015| Data | 1975 | 1990 | 2000 | 2015 |
|---|---|---|---|---|
| Population | 12,908 | 13,369 | 14,184 | 13,898 |
| Population Density | 2,169 / km² | 2,246 / km² | 2,383 / km² | 2,335 / km² |
Überlingen Population change from 2000 to 2015
Decrease of 2% from year 2000 to 2015| Location | Change since 1975 | Change since 1990 | Change since 2000 |
|---|---|---|---|
| Überlingen, Baden-Württemberg | +7.7% | +4% | -2% |
| Baden-Württemberg Region | +10.4% | +6.4% | +0.8% |
| Germany | +2.6% | +2.2% | -1.5% |
Überlingen, Baden-Württemberg Median Age
Median Age: 44.8 years| Location | Median Age | Median Age (Female) | Median Age (Male) |
|---|---|---|---|
| Überlingen, Baden-Württemberg | 44.8 years | 45.8 years | 43.7 years |
| Baden-Württemberg Region | 43.5 years | 44.6 years | 42.4 years |
| Germany | 44.8 years | 46 years | 43.6 years |
Überlingen, Baden-Württemberg Population Tree
Population By Age and Gender| Age | Male | Female | Total |
|---|---|---|---|
| Under 5 | 277 | 300 | 577 |
| 5-9 | 307 | 326 | 633 |
| 10-14 | 365 | 391 | 757 |
| 15-19 | 392 | 424 | 817 |
| 20-24 | 366 | 405 | 771 |
| 25-29 | 347 | 404 | 751 |
| 30-34 | 375 | 394 | 769 |
| 35-39 | 383 | 419 | 802 |
| 40-44 | 519 | 590 | 1,109 |
| 45-49 | 565 | 638 | 1,204 |
| 50-54 | 490 | 565 | 1,055 |
| 55-59 | 403 | 494 | 897 |
| 60-64 | 378 | 463 | 841 |
| 65-69 | 367 | 436 | 803 |
| 70-74 | 397 | 483 | 881 |
| 75-79 | 226 | 293 | 519 |
| 80-84 | 141 | 228 | 370 |
| 85 Plus | 87 | 261 | 349 |
Überlingen, Baden-Württemberg Population Density
Population Density: 2,335 / km²| Location | Population | Area | Population Density |
|---|---|---|---|
| Überlingen, Baden-Württemberg | 13,898 | 5.9 km² | 2,335 / km² |
| Baden-Württemberg Region | 10.6 million | 35,793.9 km² | 296.7 / km² |
| Germany | 80.7 million | 358,179.8 km² | 225.2 / km² |
Überlingen, Baden-Württemberg Historical and Projected Population
Estimated Ancient Population until 2100Sources:
1. JRC (European Commission's Joint Research Centre) work on the GHS built-up grid
2. CIESIN (Center for International Earth Science Information Network)
3. [Link] Klein Goldewijk, K., Beusen, A., Doelman, J., and Stehfest, E.: Anthropogenic land use estimates for the Holocene – HYDE 3.2, Earth Syst. Sci. Data, 9, 927–953, https://doi.org/10.5194/essd-9-927-2017, 2017.
Neighborhoods
Business Distribution by neighborhood in Überlingen Nußdorf: 30.9%
Deisendorf: 18.7%
Lippertsreute: 11.7%
Goldbach: 10.1%
Bambergen: 7.7%
Andelshofen: 7%
Bonndorf: 5.4%
Other: 8.4%
Business distribution by price for Überlingen, Baden-Württemberg
Inexpensive: 63.5%
Moderate: 32.4%
Very Expensive: 2.7%
Expensive: 1.4%
Human Development Index (HDI)
Statistic composite index of life expectancy, education, and per capita income.Sources: [Link] Kummu, M., Taka, M. & Guillaume, J. Gridded global datasets for Gross Domestic Product and Human Development Index over 1990–2015. Sci Data 5, 180004 (2018) doi:10.1038/sdata.2018.4
Überlingen, Baden-Württemberg CO2 Emissions
Carbon Dioxide (CO2) Emissions Per Capita in Tonnes Per Year| Location | CO2 Emissions | CO2 Emissions Per Capita | CO2 Emissions Intensity |
|---|---|---|---|
| Überlingen, Baden-Württemberg | 136,306 tn | 9.81 tn | 22,908 tons/km² |
| Baden-Württemberg Region | 100,584,924 tn | 9.47 tn | 2,810 tons/km² |
| Germany | 755,339,039 tn | 9.36 tn | 2,108 tons/km² |
Überlingen, Baden-Württemberg CO2 Emissions
| 2013 CO2 emissions (tonnes/year) | 136,306 tn |
| 2013 CO2 emissions (tonnes/year) per capita | 9.81 tn |
| 2013 CO2 emissions intensity (tonnes/km²/year) | 22,908 tons/km² |
Natural Hazards Risk
Relative risk out of 10| Flood | High (9) |
| Earthquake | Medium (4) |
* Risk, particularly concerning flood or landslide, may not be for the entire area.
Sources: 1. Dilley, M., R.S. Chen, U. Deichmann, A.L. Lerner-Lam, M. Arnold, J. Agwe, P. Buys, O. Kjekstad, B. Lyon, and G. Yetman. 2005. Natural Disaster Hotspots: A Global Risk Analysis. Washington, D.C.: World Bank. https://doi.org/10.1596/0-8213-5930-4.
2. Center for Hazards and Risk Research - CHRR - Columbia University, Center for International Earth Science Information Network - CIESIN - Columbia University. 2005. Global Flood Hazard Frequency and Distribution. Palisades, NY: NASA Socioeconomic Data and Applications Center (SEDAC). https://doi.org/10.7927/H4668B3D.
3. Center for Hazards and Risk Research - CHRR - Columbia University, Center for International Earth Science Information Network - CIESIN - Columbia University. 2005. Global Earthquake Hazard Distribution - Peak Ground Acceleration. Palisades, NY: NASA Socioeconomic Data and Applications Center (SEDAC). https://doi.org/10.7927/H4BZ63ZS.
Recent Nearby Earthquakes
Magnitude 3.0 and greater| Date | Time | Magnitude | Distance | Depth | Location | Link |
|---|---|---|---|---|---|---|
| 7/19/13 | 8:30 PM | 3.6 | 40.4 km | 4,200 m | 3km ESE of Andwil, Switzerland | usgs.gov |
| 12/25/08 | 11:21 AM | 3.1 | 39 km | 10,000 m | Germany | usgs.gov |
| 12/15/08 | 4:34 PM | 3.1 | 35.7 km | 7,000 m | Switzerland | usgs.gov |
| 8/16/07 | 2:36 AM | 3.4 | 49.5 km | 6,000 m | Germany | usgs.gov |
| 11/23/04 | 9:41 AM | 3.7 | 21.2 km | 10,000 m | Germany | usgs.gov |
| 4/17/04 | 8:21 PM | 3.1 | 43.3 km | 33,000 m | Germany | usgs.gov |
| 4/15/04 | 8:14 AM | 3.3 | 46.4 km | 13,000 m | Switzerland | usgs.gov |
| 9/2/03 | 7:28 PM | 3.4 | 21.3 km | 18,000 m | Germany | usgs.gov |
| 4/11/03 | 9:04 AM | 3.4 | 51.7 km | 7,000 m | Germany | usgs.gov |
| 3/22/03 | 5:36 AM | 4.7 | 50.6 km | 6,000 m | Germany | usgs.gov |
Find historical earthquake occurrences near Überlingen, Baden-Württemberg
Earliest Date Latest Date
Magnitude 3.0 and greater Magnitude 4.0 and greater Magnitude 5.0 and greater

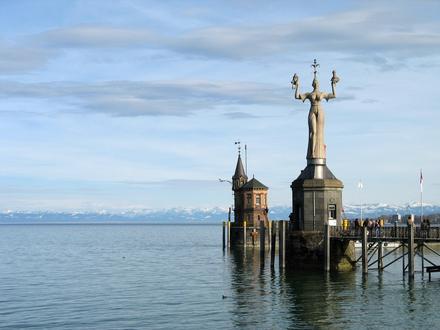
Überlingen, Baden-Württemberg
Überlingen is a city on the northern shore of Lake Constance (Bodensee). After the city of Friedrichshafen, it is the second largest city in the Bodenseekreis (district), and a central point for the outlying communities. Since January 1, 1993, Überli.. Überlingen Wikipedia Page

About Our Data
The data on this page is estimated using a number of publicly available tools and resources. It is provided without warranty, and could contain inaccuracies. Use at your own risk. See here for more information.