Businesses in Bad Doberan
Hotels & Travel
Restaurants
Automotive
Financial Services
Medical
Beauty & Spas
Community & Government
Industries
Business Distribution by Industry Shopping: 15.1%
Medical: 13.2%
Professional Services: 12.1%
Home Services: 8.9%
Hotels & Travel: 7.4%
Industry: 6.7%
Restaurants: 5.2%
Other: 31.4%
| Industry Description | Number of Establishments | Average Google Rating | Businesses per 1,000 residents |
|---|---|---|---|
| Car repair | 18 | 4.4 | 1.8 |
| New car dealers | 14 | 4.2 | 1.4 |
| Beauty salons | 24 | 4.5 | 2.5 |
| Hairdressers | 19 | 4.4 | 2.0 |
| Art galleries | 10 | 4.3 | 1.0 |
| Banks | 12 | 3.8 | 1.2 |
| Loan companies | 24 | 3.5 | 2.5 |
| Bakeries | 10 | 4.4 | 1.0 |
| Grocery stores and supermarkets | 21 | 4.3 | 2.2 |
| Electrical installation | 11 | 1.1 | |
| General contractors | 16 | 4.1 | 1.6 |
| Kitchen and bath cabinets and remodel | 12 | 4.6 | 1.2 |
| Other construction | 13 | 4.8 | 1.3 |
| Plumbing installation and repair | 11 | 5.0 | 1.1 |
| Real estate | 30 | 4.6 | 3.1 |
| Holiday homes, cabins and resorts | 10 | 4.4 | 1.0 |
| Hostels | 13 | 4.5 | 1.3 |
| Hotels and motels | 21 | 4.3 | 2.2 |
| Other accommodation | 41 | 4.3 | 4.2 |
| Travel agencies | 16 | 4.4 | 1.6 |
| Dentists | 19 | 4.5 | 2.0 |
| Health and medical | 129 | 4.2 | 13.3 |
| Hospitals | 10 | 2.8 | 1.0 |
| Architects | 12 | 5.0 | 1.2 |
| Lawyers legal | 15 | 4.6 | 1.5 |
| Technical construction services | 15 | 3.7 | 1.5 |
| Cafes | 11 | 4.6 | 1.1 |
| Clothing stores | 10 | 4.3 | 1.0 |
| Pharmacies and drug stores | 13 | 4.4 | 1.3 |
| Area of Bad Doberan, Mecklenburg-Vorpommern | 5.8 km² |
| Population | 9,734 |
| Male Population | 4,662 (47.9%) |
| Female Population | 5,072 (52.1%) |
| Population change from 1975 to 2015 | -3.9% |
| Population change from 2000 to 2015 | -5.4% |
| Median Age | 48 |
| Male Median Age | 46.5 |
| Female Median Age | 49.3 |
| Area Codes | 38203 |
| Neighborhoods | Heiligendamm, Vorder Bollhagen |
| Local Time | Friday 4:03 AM |
| Timezone | Central European Summer Time |
| Lat & Lng | 54.10712° / 11.90051° |
Bad Doberan, Mecklenburg-Vorpommern - Map
Bad Doberan, Mecklenburg-Vorpommern Population
Years 1975 to 2015| Data | 1975 | 1990 | 2000 | 2015 |
|---|---|---|---|---|
| Population | 10,134 | 10,008 | 10,292 | 9,734 |
| Population Density | 1,744 / km² | 1,722 / km² | 1,771 / km² | 1,675 / km² |
Bad Doberan Population change from 2000 to 2015
Decrease of 5.4% from year 2000 to 2015| Location | Change since 1975 | Change since 1990 | Change since 2000 |
|---|---|---|---|
| Bad Doberan, Mecklenburg-Vorpommern | -3.9% | -2.7% | -5.4% |
| Mecklenburg-Vorpommern | -19.6% | -12.3% | -10.1% |
| Germany | +2.6% | +2.2% | -1.5% |
Bad Doberan, Mecklenburg-Vorpommern Median Age
Median Age: 48 years| Location | Median Age | Median Age (Female) | Median Age (Male) |
|---|---|---|---|
| Bad Doberan, Mecklenburg-Vorpommern | 48 years | 49.3 years | 46.5 years |
| Mecklenburg-Vorpommern | 47.6 years | 49.1 years | 46 years |
| Germany | 44.8 years | 46 years | 43.6 years |
Bad Doberan, Mecklenburg-Vorpommern Population Tree
Population By Age and Gender| Age | Male | Female | Total |
|---|---|---|---|
| Under 5 | 188 | 196 | 385 |
| 5-9 | 188 | 193 | 382 |
| 10-14 | 187 | 189 | 377 |
| 15-19 | 159 | 155 | 315 |
| 20-24 | 306 | 275 | 581 |
| 25-29 | 292 | 273 | 565 |
| 30-34 | 281 | 262 | 543 |
| 35-39 | 251 | 239 | 490 |
| 40-44 | 343 | 350 | 694 |
| 45-49 | 463 | 467 | 930 |
| 50-54 | 448 | 459 | 908 |
| 55-59 | 413 | 434 | 848 |
| 60-64 | 282 | 302 | 585 |
| 65-69 | 242 | 280 | 522 |
| 70-74 | 292 | 378 | 670 |
| 75-79 | 189 | 279 | 468 |
| 80-84 | 97 | 192 | 290 |
| 85 Plus | 41 | 150 | 191 |
Bad Doberan, Mecklenburg-Vorpommern Population Density
Population Density: 1,675 / km²| Location | Population | Area | Population Density |
|---|---|---|---|
| Bad Doberan, Mecklenburg-Vorpommern | 9,734 | 5.8 km² | 1,675 / km² |
| Mecklenburg-Vorpommern | 1.6 million | 23,289 km² | 66.9 / km² |
| Germany | 80.7 million | 358,179.8 km² | 225.2 / km² |
Bad Doberan, Mecklenburg-Vorpommern Historical Population
Estimated Ancient Population until 2015Sources:
1. JRC (European Commission's Joint Research Centre) work on the GHS built-up grid
2. CIESIN (Center for International Earth Science Information Network)
3. [Link] Klein Goldewijk, K., Beusen, A., Doelman, J., and Stehfest, E.: Anthropogenic land use estimates for the Holocene – HYDE 3.2, Earth Syst. Sci. Data, 9, 927–953, https://doi.org/10.5194/essd-9-927-2017, 2017.
Neighborhoods
Business Distribution by neighborhood in Bad Doberan Heiligendamm: 78.9%
Vorder Bollhagen: 8.8%
Other: 12.3%
Business distribution by price for Bad Doberan, Mecklenburg-Vorpommern
Inexpensive: 62.1%
Moderate: 20.7%
Very Expensive: 17.2%
Human Development Index (HDI)
Statistic composite index of life expectancy, education, and per capita income.Sources: [Link] Kummu, M., Taka, M. & Guillaume, J. Gridded global datasets for Gross Domestic Product and Human Development Index over 1990–2015. Sci Data 5, 180004 (2018) doi:10.1038/sdata.2018.4
Bad Doberan, Mecklenburg-Vorpommern CO2 Emissions
Carbon Dioxide (CO2) Emissions Per Capita in Tonnes Per Year| Location | CO2 Emissions | CO2 Emissions Per Capita | CO2 Emissions Intensity |
|---|---|---|---|
| Bad Doberan, Mecklenburg-Vorpommern | 91,478 tn | 9.4 tn | 15,744 tons/km² |
| Mecklenburg-Vorpommern | 14,301,724 tn | 9.18 tn | 614.1 tons/km² |
| Germany | 755,339,039 tn | 9.36 tn | 2,108 tons/km² |
Bad Doberan, Mecklenburg-Vorpommern CO2 Emissions
| 2013 CO2 emissions (tonnes/year) | 91,478 tn |
| 2013 CO2 emissions (tonnes/year) per capita | 9.4 tn |
| 2013 CO2 emissions intensity (tonnes/km²/year) | 15,744 tons/km² |
Recent Nearby Earthquakes
Magnitude 3.0 and greater| Date | Time | Magnitude | Distance | Depth | Location | Link |
|---|---|---|---|---|---|---|
| 7/21/01 | 9:35 AM | 3.5 | 41 km | 10,000 m | Germany | usgs.gov |

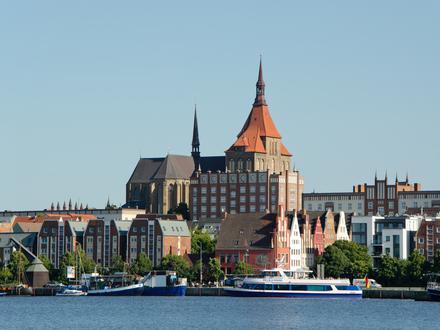
Bad Doberan, Mecklenburg-Vorpommern
Bad Doberan (German pronunciation: [baːt dobəˈʁaːn]) is a town in the district of Rostock, Mecklenburg-Vorpommern, Germany. It was the capital of the former district of Bad Doberan. As of 2012 its population was 11,427. Bad Doberan Wikipedia Page
About Our Data
The data on this page is estimated using a number of publicly available tools and resources. It is provided without warranty, and could contain inaccuracies. Use at your own risk. See here for more information.