- World
- »
- DE
- »
- Bavaria
- »
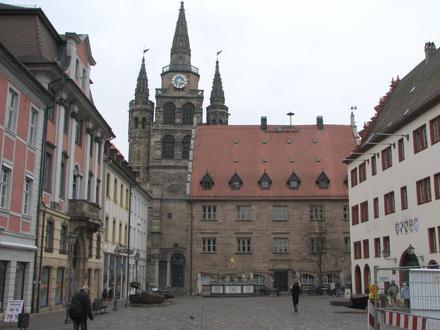
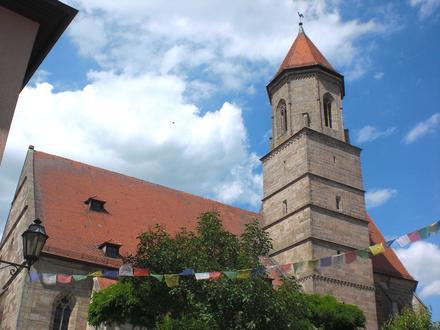
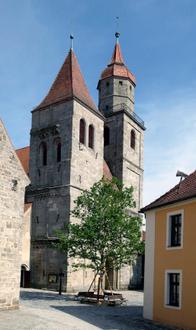
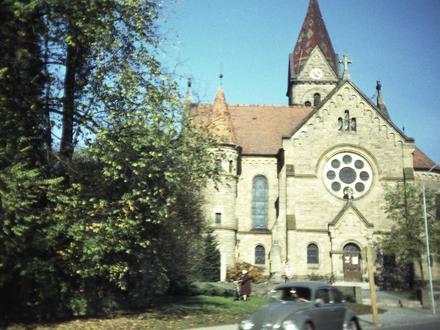
- Burgoberbach, Bavaria
Businesses in Burgoberbach
Hotels & Travel
Restaurants
Automotive
Financial Services
Medical
Beauty & Spas
Community & Government
Industries
Business Distribution by Industry Shopping: 18.2%
Industry: 13.9%
Home Services: 9.5%
Professional Services: 9.5%
Automotive: 7.9%
Medical: 6.5%
Food: 5.8%
Sports & Activities: 5.3%
Other: 23.3%
| Industry Description | Number of Establishments | Average Google Rating | Businesses per 1,000 residents |
|---|---|---|---|
| General contractors | 10 | 4.2 | 7.0 |
| Area of Burgoberbach, Bavaria | 0.97 km² |
| Population | 1,425 |
| Male Population | 708 (49.7%) |
| Female Population | 717 (50.3%) |
| Population change from 1975 to 2015 | -31.6% |
| Population change from 2000 to 2015 | -14.7% |
| Median Age | 43.9 |
| Male Median Age | 42.9 |
| Female Median Age | 44.8 |
| Area Codes | 9805 |
| Neighborhoods | Claffheim, Neuses, Niederoberbach, Sommersdorf |
| Local Time | Friday 5:40 PM |
| Timezone | Central European Summer Time |
| Lat & Lng | 49.23333° / 10.58333° |
| Postal Codes | 91595 |
Burgoberbach, Bavaria - Map
Burgoberbach, Bavaria Population
Years 1975 to 2015| Data | 1975 | 1990 | 2000 | 2015 |
|---|---|---|---|---|
| Population | 2,083 | 1,832 | 1,670 | 1,425 |
| Population Density | 2,147 / km² | 1,888 / km² | 1,721 / km² | 1,469 / km² |
Burgoberbach Population change from 2000 to 2015
Decrease of 14.7% from year 2000 to 2015| Location | Change since 1975 | Change since 1990 | Change since 2000 |
|---|---|---|---|
| Burgoberbach, Bavaria | -31.6% | -22.2% | -14.7% |
| Bayern | +18.8% | +11.8% | +3.9% |
| Germany | +2.6% | +2.2% | -1.5% |
Burgoberbach, Bavaria Median Age
Median Age: 43.9 years| Location | Median Age | Median Age (Female) | Median Age (Male) |
|---|---|---|---|
| Burgoberbach, Bavaria | 43.9 years | 44.8 years | 42.9 years |
| Bayern | 43.9 years | 44.9 years | 42.8 years |
| Germany | 44.8 years | 46 years | 43.6 years |
Burgoberbach, Bavaria Population Tree
Population By Age and Gender| Age | Male | Female | Total |
|---|---|---|---|
| Under 5 | 30 | 29 | 60 |
| 5-9 | 35 | 32 | 67 |
| 10-14 | 44 | 41 | 85 |
| 15-19 | 48 | 44 | 92 |
| 20-24 | 46 | 41 | 87 |
| 25-29 | 40 | 37 | 78 |
| 30-34 | 38 | 39 | 78 |
| 35-39 | 41 | 42 | 84 |
| 40-44 | 56 | 57 | 113 |
| 45-49 | 65 | 62 | 128 |
| 50-54 | 59 | 57 | 116 |
| 55-59 | 49 | 47 | 97 |
| 60-64 | 41 | 39 | 81 |
| 65-69 | 29 | 29 | 58 |
| 70-74 | 38 | 42 | 81 |
| 75-79 | 25 | 32 | 57 |
| 80-84 | 15 | 25 | 41 |
| 85 Plus | 8 | 24 | 33 |
Burgoberbach, Bavaria Population Density
Population Density: 1,469 / km²| Location | Population | Area | Population Density |
|---|---|---|---|
| Burgoberbach, Bavaria | 1,425 | 0.97 km² | 1,469 / km² |
| Bayern | 12.7 million | 70,548.3 km² | 179.5 / km² |
| Germany | 80.7 million | 358,179.8 km² | 225.2 / km² |
Burgoberbach, Bavaria Projected Population
Estimated Population from 1975 to 2100Sources:
1. JRC (European Commission's Joint Research Centre) work on the GHS built-up grid
2. CIESIN (Center for International Earth Science Information Network)
3. [Link] Klein Goldewijk, K., Beusen, A., Doelman, J., and Stehfest, E.: Anthropogenic land use estimates for the Holocene – HYDE 3.2, Earth Syst. Sci. Data, 9, 927–953, https://doi.org/10.5194/essd-9-927-2017, 2017.
Neighborhoods
Business Distribution by neighborhood in Burgoberbach Niederoberbach: 33.3%
Neuses: 30.3%
Sommersdorf: 24.2%
Claffheim: 9.1%
Gerersdorf: 3%
Area Codes
Percentage Area Codes used by businesses in Burgoberbach Area Code 9805: 89.7%
Area Code 981: 5.1%
Other: 5.1%
Human Development Index (HDI)
Statistic composite index of life expectancy, education, and per capita income.Sources: [Link] Kummu, M., Taka, M. & Guillaume, J. Gridded global datasets for Gross Domestic Product and Human Development Index over 1990–2015. Sci Data 5, 180004 (2018) doi:10.1038/sdata.2018.4
Burgoberbach, Bavaria CO2 Emissions
Carbon Dioxide (CO2) Emissions Per Capita in Tonnes Per Year| Location | CO2 Emissions | CO2 Emissions Per Capita | CO2 Emissions Intensity |
|---|---|---|---|
| Burgoberbach, Bavaria | 13,545 tn | 9.51 tn | 13,964 tons/km² |
| Bayern | 124,278,406 tn | 9.81 tn | 1,761 tons/km² |
| Germany | 755,339,039 tn | 9.36 tn | 2,108 tons/km² |
Burgoberbach, Bavaria CO2 Emissions
| 2013 CO2 emissions (tonnes/year) | 13,545 tn |
| 2013 CO2 emissions (tonnes/year) per capita | 9.51 tn |
| 2013 CO2 emissions intensity (tonnes/km²/year) | 13,964 tons/km² |
Natural Hazards Risk
Relative risk out of 10| Flood | High (10) |
| Earthquake | Low (2) |
* Risk, particularly concerning flood or landslide, may not be for the entire area.
Sources: 1. Dilley, M., R.S. Chen, U. Deichmann, A.L. Lerner-Lam, M. Arnold, J. Agwe, P. Buys, O. Kjekstad, B. Lyon, and G. Yetman. 2005. Natural Disaster Hotspots: A Global Risk Analysis. Washington, D.C.: World Bank. https://doi.org/10.1596/0-8213-5930-4.
2. Center for Hazards and Risk Research - CHRR - Columbia University, Center for International Earth Science Information Network - CIESIN - Columbia University. 2005. Global Flood Hazard Frequency and Distribution. Palisades, NY: NASA Socioeconomic Data and Applications Center (SEDAC). https://doi.org/10.7927/H4668B3D.
3. Center for Hazards and Risk Research - CHRR - Columbia University, Center for International Earth Science Information Network - CIESIN - Columbia University. 2005. Global Earthquake Hazard Distribution - Peak Ground Acceleration. Palisades, NY: NASA Socioeconomic Data and Applications Center (SEDAC). https://doi.org/10.7927/H4BZ63ZS.
Recent Nearby Earthquakes
Magnitude 3.0 and greaterBurgoberbach, Bavaria
Burgoberbach is a municipality in the district of Ansbach in Bavaria in Germany. the graveyard of the Catholic church of St. Leonhard lies the grave of Flying Officer George Warren, administered by the Commonwealth War Graves Commission. Burgoberbach Wikipedia Page
About Our Data
The data on this page is estimated using a number of publicly available tools and resources. It is provided without warranty, and could contain inaccuracies. Use at your own risk. See here for more information.