Businesses in Emlichheim
Hotels & Travel
Restaurants
Automotive
Financial Services
Medical
Beauty & Spas
Community & Government
Industries
Business Distribution by Industry Industry: 20.6%
Shopping: 16%
Home Services: 8.6%
Professional Services: 8%
Food: 6.2%
Medical: 6.1%
Restaurants: 5.7%
Hotels & Travel: 5.1%
Other: 23.7%
| Industry Description | Number of Establishments | Average Google Rating | Businesses per 1,000 residents |
|---|---|---|---|
| Beauty salons | 7 | 4.5 | 1.9 |
| Hairdressers | 5 | 4.5 | 1.3 |
| Finance other | 7 | 3.7 | 1.9 |
| Loan companies | 8 | 2.1 | |
| Bakeries | 6 | 4.2 | 1.6 |
| Grocery stores and supermarkets | 19 | 4.2 | 5.0 |
| General contractors | 6 | 4.3 | 1.6 |
| Hotels and motels | 7 | 4.2 | 1.9 |
| Other accommodation | 11 | 4.2 | 2.9 |
| Construction | 7 | 4.3 | 1.9 |
| Tractors and farm equipment | 13 | 4.7 | 3.5 |
| Wholesale of machinery | 7 | 4.5 | 1.9 |
| Wholesalers | 9 | 4.2 | 2.4 |
| Health and medical | 16 | 4.3 | 4.3 |
| Churches | 6 | 4.2 | 1.6 |
| Pizza | 6 | 4.1 | 1.6 |
| Clothing stores | 7 | 4.1 | 1.9 |
| Electronics stores | 8 | 5.0 | 2.1 |
| Hardware stores | 6 | 3.9 | 1.6 |
| Household appliances and goods | 7 | 4.4 | 1.9 |
| Pharmacies and drug stores | 6 | 4.5 | 1.6 |
| Area of Emlichheim, Lower Saxony | 3.11 km² |
| Population | 3,763 |
| Male Population | 1,878 (49.9%) |
| Female Population | 1,885 (50.1%) |
| Population change from 1975 to 2015 | -20.2% |
| Population change from 2000 to 2015 | -11% |
| Median Age | 43.5 |
| Male Median Age | 42.7 |
| Female Median Age | 44.2 |
| Area Codes | 5943 |
| Neighborhoods | Haselaar, Richtervenne, Volzel |
| Local Time | Friday 5:25 PM |
| Timezone | Central European Summer Time |
| Lat & Lng | 52.61667° / 6.85° |
| Postal Codes | 49824 |
Emlichheim, Lower Saxony - Map
Emlichheim, Lower Saxony Population
Years 1975 to 2015| Data | 1975 | 1990 | 2000 | 2015 |
|---|---|---|---|---|
| Population | 4,716 | 4,552 | 4,226 | 3,763 |
| Population Density | 1,516 / km² | 1,463 / km² | 1,358 / km² | 1,209 / km² |
Emlichheim Population change from 2000 to 2015
Decrease of 11% from year 2000 to 2015| Location | Change since 1975 | Change since 1990 | Change since 2000 |
|---|---|---|---|
| Emlichheim, Lower Saxony | -20.2% | -17.3% | -11% |
| Niedersachsen | +4.3% | +2.8% | -1.3% |
| Germany | +2.6% | +2.2% | -1.5% |
Emlichheim, Lower Saxony Median Age
Median Age: 43.5 years| Location | Median Age | Median Age (Female) | Median Age (Male) |
|---|---|---|---|
| Emlichheim, Lower Saxony | 43.5 years | 44.2 years | 42.7 years |
| Niedersachsen | 44.8 years | 45.8 years | 43.7 years |
| Germany | 44.8 years | 46 years | 43.6 years |
Emlichheim, Lower Saxony Population Tree
Population By Age and Gender| Age | Male | Female | Total |
|---|---|---|---|
| Under 5 | 89 | 81 | 170 |
| 5-9 | 100 | 93 | 193 |
| 10-14 | 121 | 115 | 236 |
| 15-19 | 121 | 120 | 242 |
| 20-24 | 116 | 98 | 215 |
| 25-29 | 101 | 96 | 198 |
| 30-34 | 98 | 98 | 196 |
| 35-39 | 109 | 112 | 221 |
| 40-44 | 157 | 153 | 311 |
| 45-49 | 173 | 160 | 334 |
| 50-54 | 144 | 135 | 279 |
| 55-59 | 124 | 120 | 245 |
| 60-64 | 109 | 108 | 218 |
| 65-69 | 85 | 84 | 169 |
| 70-74 | 98 | 109 | 208 |
| 75-79 | 66 | 83 | 149 |
| 80-84 | 42 | 65 | 108 |
| 85 Plus | 23 | 56 | 80 |
Emlichheim, Lower Saxony Population Density
Population Density: 1,209 / km²| Location | Population | Area | Population Density |
|---|---|---|---|
| Emlichheim, Lower Saxony | 3,763 | 3.11 km² | 1,209 / km² |
| Niedersachsen | 7.8 million | 47,789.6 km² | 163.7 / km² |
| Germany | 80.7 million | 358,179.8 km² | 225.2 / km² |
Emlichheim, Lower Saxony Projected Population
Estimated Population from 1975 to 2100Sources:
1. JRC (European Commission's Joint Research Centre) work on the GHS built-up grid
2. CIESIN (Center for International Earth Science Information Network)
3. [Link] Klein Goldewijk, K., Beusen, A., Doelman, J., and Stehfest, E.: Anthropogenic land use estimates for the Holocene – HYDE 3.2, Earth Syst. Sci. Data, 9, 927–953, https://doi.org/10.5194/essd-9-927-2017, 2017.
Neighborhoods
Business Distribution by neighborhood in Emlichheim Richtervenne: 72.3%
Volzel: 21.3%
Haselaar: 6.4%
Human Development Index (HDI)
Statistic composite index of life expectancy, education, and per capita income.Sources: [Link] Kummu, M., Taka, M. & Guillaume, J. Gridded global datasets for Gross Domestic Product and Human Development Index over 1990–2015. Sci Data 5, 180004 (2018) doi:10.1038/sdata.2018.4
Emlichheim, Lower Saxony CO2 Emissions
Carbon Dioxide (CO2) Emissions Per Capita in Tonnes Per Year| Location | CO2 Emissions | CO2 Emissions Per Capita | CO2 Emissions Intensity |
|---|---|---|---|
| Emlichheim, Lower Saxony | 36,049 tn | 9.58 tn | 11,591 tons/km² |
| Niedersachsen | 78,468,652 tn | 10 tn | 1,641 tons/km² |
| Germany | 755,339,039 tn | 9.36 tn | 2,108 tons/km² |
Emlichheim, Lower Saxony CO2 Emissions
| 2013 CO2 emissions (tonnes/year) | 36,049 tn |
| 2013 CO2 emissions (tonnes/year) per capita | 9.58 tn |
| 2013 CO2 emissions intensity (tonnes/km²/year) | 11,591 tons/km² |
Natural Hazards Risk
Relative risk out of 10| Flood | Medium (4) |
* Risk, particularly concerning flood or landslide, may not be for the entire area.
Sources: 1. Dilley, M., R.S. Chen, U. Deichmann, A.L. Lerner-Lam, M. Arnold, J. Agwe, P. Buys, O. Kjekstad, B. Lyon, and G. Yetman. 2005. Natural Disaster Hotspots: A Global Risk Analysis. Washington, D.C.: World Bank. https://doi.org/10.1596/0-8213-5930-4.
2. Center for Hazards and Risk Research - CHRR - Columbia University, Center for International Earth Science Information Network - CIESIN - Columbia University. 2005. Global Flood Hazard Frequency and Distribution. Palisades, NY: NASA Socioeconomic Data and Applications Center (SEDAC). https://doi.org/10.7927/H4668B3D.
Recent Nearby Earthquakes
Magnitude 3.0 and greater| Date | Time | Magnitude | Distance | Depth | Location | Link |
|---|---|---|---|---|---|---|
| 5/21/19 | 8:48 PM | 3.2 | 88.2 km | 10,000 m | 8km NNE of Winsum, Netherlands | usgs.gov |
| 2/7/13 | 3:19 PM | 3.4 | 89.6 km | 10,000 m | 11km NNE of Winsum, Netherlands | usgs.gov |
| 8/16/12 | 1:30 PM | 3.4 | 81 km | 3,000 m | The Netherlands | usgs.gov |
| 10/29/08 | 10:54 PM | 3.3 | 86.3 km | 3,000 m | The Netherlands | usgs.gov |
| 7/18/08 | 11:12 AM | 3.4 | 63.6 km | 5,000 m | Germany | usgs.gov |
| 3/20/07 | 12:54 PM | 3.7 | 58.7 km | 10,000 m | Germany | usgs.gov |
| 8/7/06 | 10:03 PM | 3.8 | 85.7 km | 10,000 m | The Netherlands | usgs.gov |
| 11/9/03 | 4:22 PM | 3.1 | 92.5 km | 10,000 m | The Netherlands | usgs.gov |
| 1/6/03 | 1:49 PM | 4.3 | 61.4 km | 10,000 m | Germany | usgs.gov |
| 8/3/95 | 10:47 AM | 3.6 | 72.4 km | 10,000 m | Germany | usgs.gov |
Find historical earthquake occurrences near Emlichheim, Lower Saxony
Earliest Date Latest Date
Magnitude 3.0 and greater Magnitude 4.0 and greater Magnitude 5.0 and greater

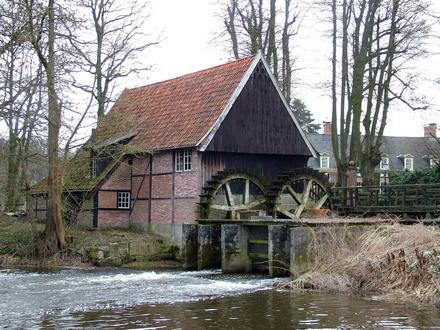
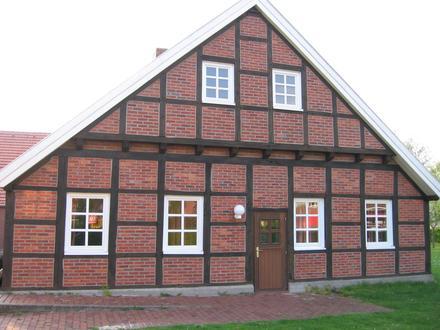
Emlichheim, Lower Saxony
Emlichheim is a municipality in the district of Grafschaft Bentheim in Lower Saxony, Germany, roughly 20 km south of Emmen, and 25 km northwest of Nordhorn. Emlichheim Wikipedia Page

About Our Data
The data on this page is estimated using a number of publicly available tools and resources. It is provided without warranty, and could contain inaccuracies. Use at your own risk. See here for more information.