Businesses in Hallenberg
Hotels & Travel
Restaurants
Automotive
Financial Services
Medical
Beauty & Spas
Community & Government
Industries
Business Distribution by Industry Shopping: 17.9%
Industry: 15.2%
Hotels & Travel: 11.5%
Home Services: 9.7%
Professional Services: 9.3%
Restaurants: 5.8%
Food: 5.2%
Other: 25.4%
| Area of Hallenberg, North Rhine-Westphalia | 1.69 km² |
| Population | 1,870 |
| Population change from 1975 to 2015 | -31.3% |
| Population change from 2000 to 2015 | -15.3% |
| Area Codes | 2984 |
| Neighborhoods | Braunshausen, Herges, Herges-Hallenberg, Hesborn, Liesen |
| Local Time | Friday 4:54 AM |
| Timezone | Central European Summer Time |
| Lat & Lng | 51.11115° / 8.62008° |
| Postal Codes | 59969 |
Hallenberg, North Rhine-Westphalia - Map
Hallenberg, North Rhine-Westphalia Population
Years 1975 to 2015| Data | 1975 | 1990 | 2000 | 2015 |
|---|---|---|---|---|
| Population | 2,722 | 2,332 | 2,207 | 1,870 |
| Population Density | 1,610 / km² | 1,379 / km² | 1,305 / km² | 1,106 / km² |
Hallenberg Population change from 2000 to 2015
Decrease of 15.3% from year 2000 to 2015| Location | Change since 1975 | Change since 1990 | Change since 2000 |
|---|---|---|---|
| Hallenberg, North Rhine-Westphalia | -31.3% | -19.8% | -15.3% |
| Nordrhein-Westfalen | +2.5% | +1.7% | -1.9% |
| Germany | +2.6% | +2.2% | -1.5% |
Hallenberg, North Rhine-Westphalia Population Density
Population Density: 1,106 / km²| Location | Population | Area | Population Density |
|---|---|---|---|
| Hallenberg, North Rhine-Westphalia | 1,870 | 1.69 km² | 1,106 / km² |
| Nordrhein-Westfalen | 17.6 million | 34,118.6 km² | 515.8 / km² |
| Germany | 80.7 million | 358,179.8 km² | 225.2 / km² |
Hallenberg, North Rhine-Westphalia Historical and Projected Population
Estimated Ancient Population until 2100Sources:
1. JRC (European Commission's Joint Research Centre) work on the GHS built-up grid
2. CIESIN (Center for International Earth Science Information Network)
3. [Link] Klein Goldewijk, K., Beusen, A., Doelman, J., and Stehfest, E.: Anthropogenic land use estimates for the Holocene – HYDE 3.2, Earth Syst. Sci. Data, 9, 927–953, https://doi.org/10.5194/essd-9-927-2017, 2017.
Neighborhoods
Business Distribution by neighborhood in Hallenberg Hesborn: 33.3%
Herges-Hallenberg: 26.1%
Liesen: 24.2%
Braunshausen: 11.1%
Other: 5.2%
Area Codes
Percentage Area Codes used by businesses in Hallenberg Area Code 36847: 53.3%
Area Code 2984: 42.3%
Other: 4.3%
Human Development Index (HDI)
Statistic composite index of life expectancy, education, and per capita income.Sources: [Link] Kummu, M., Taka, M. & Guillaume, J. Gridded global datasets for Gross Domestic Product and Human Development Index over 1990–2015. Sci Data 5, 180004 (2018) doi:10.1038/sdata.2018.4
Hallenberg, North Rhine-Westphalia CO2 Emissions
Carbon Dioxide (CO2) Emissions Per Capita in Tonnes Per Year| Location | CO2 Emissions | CO2 Emissions Per Capita | CO2 Emissions Intensity |
|---|---|---|---|
| Hallenberg, North Rhine-Westphalia | 18,714 tn | 10 tn | 11,073 tons/km² |
| Nordrhein-Westfalen | 176,214,894 tn | 10 tn | 5,164 tons/km² |
| Germany | 755,339,039 tn | 9.36 tn | 2,108 tons/km² |
Hallenberg, North Rhine-Westphalia CO2 Emissions
| 2013 CO2 emissions (tonnes/year) | 18,714 tn |
| 2013 CO2 emissions (tonnes/year) per capita | 10 tn |
| 2013 CO2 emissions intensity (tonnes/km²/year) | 11,073 tons/km² |
Recent Nearby Earthquakes
Magnitude 3.0 and greater| Date | Time | Magnitude | Distance | Depth | Location | Link |
|---|---|---|---|---|---|---|
| 5/23/01 | 6:34 AM | 3.2 | 87.8 km | 10,000 m | Germany | usgs.gov |
| 2/13/01 | 9:05 AM | 3.1 | 87.6 km | 10,000 m | Germany | usgs.gov |
| 11/18/00 | 12:27 PM | 3.2 | 84.1 km | 1,000 m | Germany | usgs.gov |
| 1/4/00 | 3:38 AM | 3.2 | 84.2 km | 10,000 m | Germany | usgs.gov |
| 9/23/99 | 8:53 AM | 3.1 | 70.2 km | 10,000 m | Germany | usgs.gov |
| 9/17/98 | 5:00 PM | 3.2 | 71.3 km | 10,000 m | Germany | usgs.gov |
| 8/17/98 | 10:09 PM | 3.2 | 93.8 km | 10,000 m | Germany | usgs.gov |
| 7/22/98 | 12:51 PM | 3.1 | 76 km | 10,000 m | Germany | usgs.gov |
| 6/2/95 | 3:51 AM | 3.1 | 91.7 km | 5,000 m | Germany | usgs.gov |
| 12/18/94 | 6:27 PM | 3.2 | 82.9 km | 10,000 m | Germany | usgs.gov |
Find historical earthquake occurrences near Hallenberg, North Rhine-Westphalia
Earliest Date Latest Date
Magnitude 3.0 and greater Magnitude 4.0 and greater Magnitude 5.0 and greater

Hallenberg, North Rhine-Westphalia
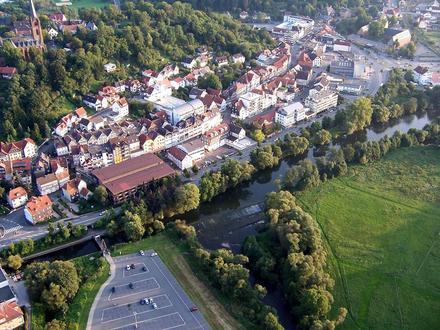
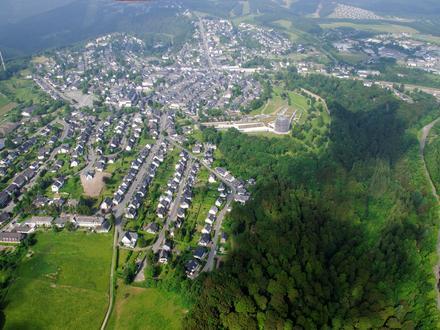
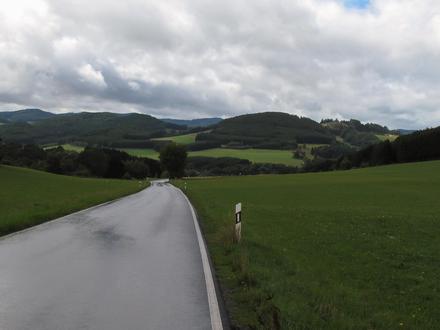
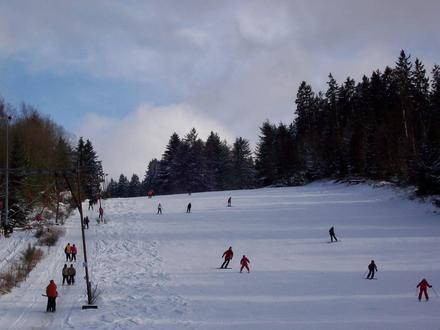
Hallenberg is a town in the Hochsauerland district, in North Rhine-Westphalia, Germany. Hallenberg Wikipedia Page
About Our Data
The data on this page is estimated using a number of publicly available tools and resources. It is provided without warranty, and could contain inaccuracies. Use at your own risk. See here for more information.