- World
- »
- DE
- »
- Brandenburg
- »
- Ihlow, Brandenburg
Businesses in Ihlow, Brandenburg
Hotels & Travel
Restaurants
Automotive
Financial Services
Medical
Beauty & Spas
Community & Government
Industries
Business Distribution by Industry Industry: 19.4%
Shopping: 15%
Home Services: 10.2%
Professional Services: 9.7%
Medical: 5.7%
Food: 5.3%
Hotels & Travel: 5.1%
Other: 29.7%
| Industry Description | Number of Establishments | Average Google Rating | Businesses per 1,000 residents |
|---|---|---|---|
| Car repair | 11 | 4.5 | 71.9 |
| Beauty salons | 14 | 4.4 | 91.5 |
| Hairdressers | 9 | 4.2 | 58.8 |
| Firefighting and rescue | 6 | 5.0 | 39.2 |
| Bakeries | 11 | 4.1 | 71.9 |
| Grocery stores and supermarkets | 24 | 4.2 | 156.9 |
| Electrical installation | 9 | 4.5 | 58.8 |
| General contractors | 24 | 4.5 | 156.9 |
| Other construction | 16 | 4.7 | 104.6 |
| Plumbing installation and repair | 13 | 4.6 | 85.0 |
| Real estate | 6 | 4.3 | 39.2 |
| Hotels and motels | 7 | 4.4 | 45.8 |
| Other accommodation | 20 | 4.3 | 130.7 |
| Construction | 8 | 5.0 | 52.3 |
| Other membership organizations | 6 | 4.6 | 39.2 |
| Tractors and farm equipment | 12 | 4.1 | 78.4 |
| Wholesale of construction supplies | 9 | 4.0 | 58.8 |
| Wholesale of machinery | 6 | 4.3 | 39.2 |
| Wholesalers | 9 | 4.9 | 58.8 |
| Health and medical | 30 | 4.7 | 196.1 |
| Technical construction services | 7 | 45.8 | |
| Cafes | 6 | 4.3 | 39.2 |
| Florists | 7 | 3.7 | 45.8 |
| Furniture stores | 6 | 4.4 | 39.2 |
| Hardware stores | 6 | 4.1 | 39.2 |
| Household appliances and goods | 6 | 4.5 | 39.2 |
| Area of Ihlow, Brandenburg | 0.37 km² |
| Population | 153 |
| Population change from 1975 to 2015 | -5.6% |
| Population change from 2000 to 2015 | -0.6% |
| Area Codes | 33744, 4924, 4928, 4929, More |
| Neighborhoods | Ihlowerfehn, Ihlowerhörn, Ludwigsdorf, Ochtelbur, Ostersander, Riepe, Simonswolde, Westerende Kirchloog |
| Local Time | Thursday 5:31 AM |
| Timezone | Central European Summer Time |
| Lat & Lng | 51.88333° / 13.33333° |
Ihlow, Brandenburg - Map
Ihlow, Brandenburg Population
Years 1975 to 2015| Data | 1975 | 1990 | 2000 | 2015 |
|---|---|---|---|---|
| Population | 162 | 158 | 154 | 153 |
| Population Density | 437.8 / km² | 427.0 / km² | 416.2 / km² | 413.5 / km² |
Ihlow, Brandenburg Population change from 2000 to 2015
Decrease of 0.6% from year 2000 to 2015| Location | Change since 1975 | Change since 1990 | Change since 2000 |
|---|---|---|---|
| Ihlow, Brandenburg | -5.6% | -3.2% | -0.6% |
| Brandenburg | -10% | -4.8% | -5.1% |
| Germany | +2.6% | +2.2% | -1.5% |
Ihlow, Brandenburg Population Density
Population Density: 413.5 / km²| Location | Population | Area | Population Density |
|---|---|---|---|
| Ihlow, Brandenburg | 153 | 0.37 km² | 413.5 / km² |
| Brandenburg | 2.5 million | 29,652.8 km² | 83.3 / km² |
| Germany | 80.7 million | 358,179.8 km² | 225.2 / km² |
Ihlow, Brandenburg Historical and Projected Population
Estimated Ancient Population until 2100Sources:
1. JRC (European Commission's Joint Research Centre) work on the GHS built-up grid
2. CIESIN (Center for International Earth Science Information Network)
3. [Link] Klein Goldewijk, K., Beusen, A., Doelman, J., and Stehfest, E.: Anthropogenic land use estimates for the Holocene – HYDE 3.2, Earth Syst. Sci. Data, 9, 927–953, https://doi.org/10.5194/essd-9-927-2017, 2017.
Neighborhoods
Business Distribution by neighborhood in Ihlow, Brandenburg Riepe: 26.8%
Ihlowerfehn: 19.5%
Westerende Kirchloog: 10.1%
Simonswolde: 7.4%
Ostersander: 5.8%
Ochtelbur: 5.6%
Ihlowerhörn: 5.4%
Other: 19.5%
Area Codes
Percentage Area Codes used by businesses in Ihlow, Brandenburg Area Code 4928: 33.7%
Area Code 4929: 25.5%
Area Code 4941: 16.3%
Area Code 4945: 6.1%
Other: 18.4%
Business distribution by price for Ihlow, Brandenburg
Inexpensive: 57.1%
Moderate: 28.6%
Very Expensive: 14.3%
Human Development Index (HDI)
Statistic composite index of life expectancy, education, and per capita income.Sources: [Link] Kummu, M., Taka, M. & Guillaume, J. Gridded global datasets for Gross Domestic Product and Human Development Index over 1990–2015. Sci Data 5, 180004 (2018) doi:10.1038/sdata.2018.4
Ihlow, Brandenburg CO2 Emissions
Carbon Dioxide (CO2) Emissions Per Capita in Tonnes Per Year| Location | CO2 Emissions | CO2 Emissions Per Capita | CO2 Emissions Intensity |
|---|---|---|---|
| Ihlow, Brandenburg | 1,397 tn | 9.14 tn | 3,777 tons/km² |
| Brandenburg | 22,189,823 tn | 8.99 tn | 748.3 tons/km² |
| Germany | 755,339,039 tn | 9.36 tn | 2,108 tons/km² |
Ihlow, Brandenburg CO2 Emissions
| 2013 CO2 emissions (tonnes/year) | 1,397 tn |
| 2013 CO2 emissions (tonnes/year) per capita | 9.14 tn |
| 2013 CO2 emissions intensity (tonnes/km²/year) | 3,777 tons/km² |
Natural Hazards Risk
Relative risk out of 10| Flood | High (7) |
* Risk, particularly concerning flood or landslide, may not be for the entire area.
Sources: 1. Dilley, M., R.S. Chen, U. Deichmann, A.L. Lerner-Lam, M. Arnold, J. Agwe, P. Buys, O. Kjekstad, B. Lyon, and G. Yetman. 2005. Natural Disaster Hotspots: A Global Risk Analysis. Washington, D.C.: World Bank. https://doi.org/10.1596/0-8213-5930-4.
2. Center for Hazards and Risk Research - CHRR - Columbia University, Center for International Earth Science Information Network - CIESIN - Columbia University. 2005. Global Flood Hazard Frequency and Distribution. Palisades, NY: NASA Socioeconomic Data and Applications Center (SEDAC). https://doi.org/10.7927/H4668B3D.
Recent Nearby Earthquakes
Magnitude 3.0 and greaterIhlow, Brandenburg
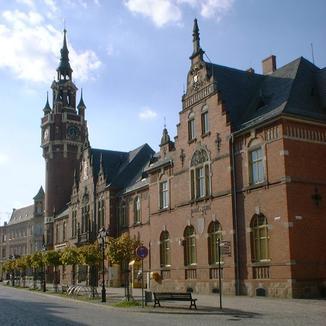
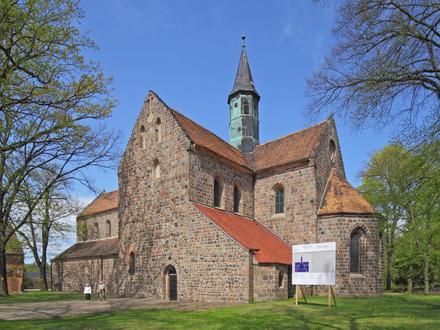
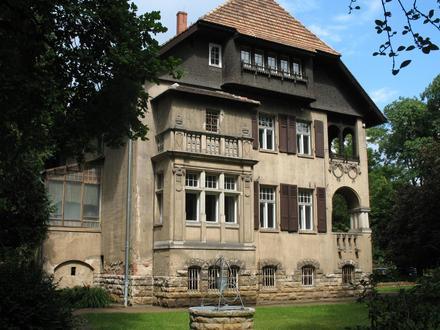
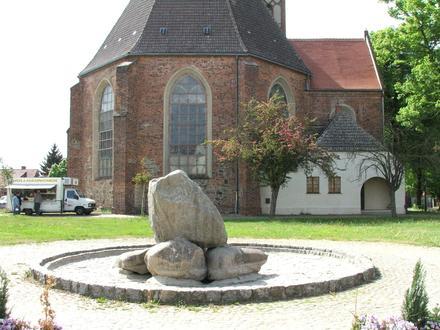
Ihlow is a municipality in the Teltow-Fläming district of Brandenburg, Germany. Ihlow, Brandenburg Wikipedia Page
About Our Data
The data on this page is estimated using a number of publicly available tools and resources. It is provided without warranty, and could contain inaccuracies. Use at your own risk. See here for more information.