Businesses in Putlitz
Hotels & Travel
Restaurants
Automotive
Financial Services
Medical
Beauty & Spas
Community & Government
Industries
Business Distribution by Industry Industry: 18.5%
Home Services: 12.8%
Shopping: 12%
Professional Services: 8.1%
Automotive: 6.2%
Medical: 5.8%
Hotels & Travel: 5.8%
Food: 5.4%
Other: 25.5%
| Industry Description | Number of Establishments | Average Google Rating | Businesses per 1,000 residents |
|---|---|---|---|
| Grocery stores and supermarkets | 12 | 4.3 | 12.2 |
| Area of Putlitz, Brandenburg | 1.51 km² |
| Population | 984 |
| Population change from 1975 to 2015 | -57.4% |
| Population change from 2000 to 2015 | -29.3% |
| Area Codes | 3395, 33981 |
| Neighborhoods | Mansfeld, Putlitz, Telschow-Weitgendorf |
| Local Time | Thursday 5:33 AM |
| Timezone | Central European Summer Time |
| Lat & Lng | 53.24899° / 12.04179° |
| Postal Codes | 16949 |
Putlitz, Brandenburg - Map
Putlitz, Brandenburg Population
Years 1975 to 2015| Data | 1975 | 1990 | 2000 | 2015 |
|---|---|---|---|---|
| Population | 2,311 | 1,625 | 1,392 | 984 |
| Population Density | 1,530 / km² | 1,076 / km² | 921.9 / km² | 651.7 / km² |
Putlitz Population change from 2000 to 2015
Decrease of 29.3% from year 2000 to 2015| Location | Change since 1975 | Change since 1990 | Change since 2000 |
|---|---|---|---|
| Putlitz, Brandenburg | -57.4% | -39.4% | -29.3% |
| Brandenburg | -10% | -4.8% | -5.1% |
| Germany | +2.6% | +2.2% | -1.5% |
Putlitz, Brandenburg Population Density
Population Density: 651.7 / km²| Location | Population | Area | Population Density |
|---|---|---|---|
| Putlitz, Brandenburg | 984 | 1.51 km² | 651.7 / km² |
| Brandenburg | 2.5 million | 29,652.8 km² | 83.3 / km² |
| Germany | 80.7 million | 358,179.8 km² | 225.2 / km² |
Putlitz, Brandenburg Historical and Projected Population
Estimated Ancient Population until 2100Sources:
1. JRC (European Commission's Joint Research Centre) work on the GHS built-up grid
2. CIESIN (Center for International Earth Science Information Network)
3. [Link] Klein Goldewijk, K., Beusen, A., Doelman, J., and Stehfest, E.: Anthropogenic land use estimates for the Holocene – HYDE 3.2, Earth Syst. Sci. Data, 9, 927–953, https://doi.org/10.5194/essd-9-927-2017, 2017.
Neighborhoods
Business Distribution by neighborhood in Putlitz Putlitz: 77.9%
Telschow-Weitgendorf: 6.9%
Other: 15.2%
Human Development Index (HDI)
Statistic composite index of life expectancy, education, and per capita income.Sources: [Link] Kummu, M., Taka, M. & Guillaume, J. Gridded global datasets for Gross Domestic Product and Human Development Index over 1990–2015. Sci Data 5, 180004 (2018) doi:10.1038/sdata.2018.4
Putlitz, Brandenburg CO2 Emissions
Carbon Dioxide (CO2) Emissions Per Capita in Tonnes Per Year| Location | CO2 Emissions | CO2 Emissions Per Capita | CO2 Emissions Intensity |
|---|---|---|---|
| Putlitz, Brandenburg | 8,520 tn | 8.66 tn | 5,642 tons/km² |
| Brandenburg | 22,189,823 tn | 8.99 tn | 748.3 tons/km² |
| Germany | 755,339,039 tn | 9.36 tn | 2,108 tons/km² |
Putlitz, Brandenburg CO2 Emissions
| 2013 CO2 emissions (tonnes/year) | 8,520 tn |
| 2013 CO2 emissions (tonnes/year) per capita | 8.66 tn |
| 2013 CO2 emissions intensity (tonnes/km²/year) | 5,642 tons/km² |
Recent Nearby Earthquakes
Magnitude 3.0 and greater
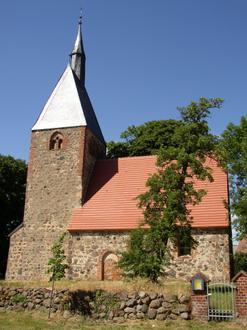
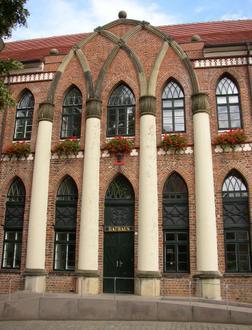
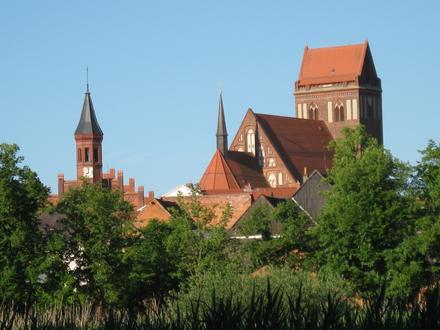
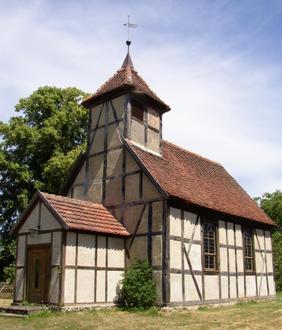
Putlitz, Brandenburg
Putlitz is a town in the district of Prignitz, in Brandenburg, Germany. It is situated 15 km northwest of Pritzwalk, and 35 km northeast of Wittenberge. Putlitz Wikipedia Page
About Our Data
The data on this page is estimated using a number of publicly available tools and resources. It is provided without warranty, and could contain inaccuracies. Use at your own risk. See here for more information.