- World
- »
- DE
- »
- Bavaria
- »
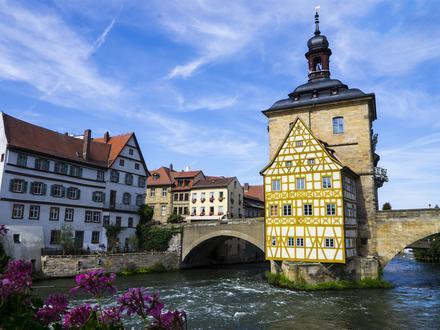
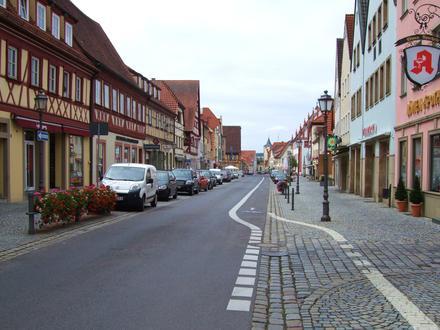
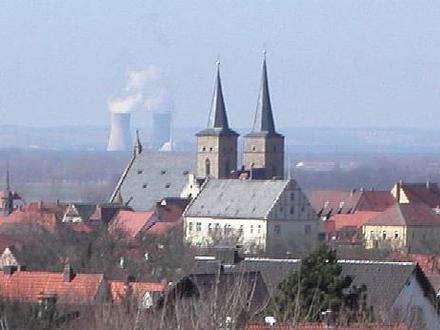
- Sand am Main, Bavaria
Businesses in Sand am Main
Hotels & Travel
Restaurants
Automotive
Financial Services
Medical
Beauty & Spas
Community & Government
Industries
Business Distribution by Industry Shopping: 25.8%
Industry: 12.5%
Professional Services: 9.6%
Food: 8.5%
Medical: 6.3%
Restaurants: 5.5%
Home Services: 5.5%
Other: 26.2%
| Area of Sand am Main, Bavaria | 1.7 km² |
| Population | 2,675 |
| Male Population | 1,352 (50.5%) |
| Female Population | 1,323 (49.5%) |
| Population change from 1975 to 2015 | -9.4% |
| Population change from 2000 to 2015 | -4.3% |
| Median Age | 44.7 |
| Male Median Age | 43.7 |
| Female Median Age | 45.7 |
| Area Codes | 9524 |
| Local Time | Thursday 11:57 AM |
| Timezone | Central European Summer Time |
| Lat & Lng | 49.98585° / 10.5862° |
| Postal Codes | 97522 |
Sand am Main, Bavaria - Map
Sand am Main, Bavaria Population
Years 1975 to 2015| Data | 1975 | 1990 | 2000 | 2015 |
|---|---|---|---|---|
| Population | 2,953 | 2,878 | 2,796 | 2,675 |
| Population Density | 1,737 / km² | 1,692 / km² | 1,644 / km² | 1,573 / km² |
Sand am Main Population change from 2000 to 2015
Decrease of 4.3% from year 2000 to 2015| Location | Change since 1975 | Change since 1990 | Change since 2000 |
|---|---|---|---|
| Sand am Main, Bavaria | -9.4% | -7.1% | -4.3% |
| Bayern | +18.8% | +11.8% | +3.9% |
| Germany | +2.6% | +2.2% | -1.5% |
Sand am Main, Bavaria Median Age
Median Age: 44.7 years| Location | Median Age | Median Age (Female) | Median Age (Male) |
|---|---|---|---|
| Sand am Main, Bavaria | 44.7 years | 45.7 years | 43.7 years |
| Bayern | 43.9 years | 44.9 years | 42.8 years |
| Germany | 44.8 years | 46 years | 43.6 years |
Sand am Main, Bavaria Population Tree
Population By Age and Gender| Age | Male | Female | Total |
|---|---|---|---|
| Under 5 | 53 | 48 | 102 |
| 5-9 | 66 | 57 | 123 |
| 10-14 | 77 | 73 | 151 |
| 15-19 | 86 | 77 | 164 |
| 20-24 | 86 | 74 | 161 |
| 25-29 | 80 | 71 | 152 |
| 30-34 | 71 | 67 | 138 |
| 35-39 | 77 | 74 | 152 |
| 40-44 | 109 | 103 | 213 |
| 45-49 | 127 | 118 | 246 |
| 50-54 | 119 | 112 | 231 |
| 55-59 | 100 | 93 | 193 |
| 60-64 | 83 | 75 | 159 |
| 65-69 | 57 | 54 | 111 |
| 70-74 | 72 | 80 | 152 |
| 75-79 | 46 | 58 | 105 |
| 80-84 | 28 | 46 | 74 |
| 85 Plus | 15 | 42 | 57 |
Sand am Main, Bavaria Population Density
Population Density: 1,573 / km²| Location | Population | Area | Population Density |
|---|---|---|---|
| Sand am Main, Bavaria | 2,675 | 1.7 km² | 1,573 / km² |
| Bayern | 12.7 million | 70,548.3 km² | 179.5 / km² |
| Germany | 80.7 million | 358,179.8 km² | 225.2 / km² |
Sand am Main, Bavaria Historical and Projected Population
Estimated Ancient Population until 2100Sources:
1. JRC (European Commission's Joint Research Centre) work on the GHS built-up grid
2. CIESIN (Center for International Earth Science Information Network)
3. [Link] Klein Goldewijk, K., Beusen, A., Doelman, J., and Stehfest, E.: Anthropogenic land use estimates for the Holocene – HYDE 3.2, Earth Syst. Sci. Data, 9, 927–953, https://doi.org/10.5194/essd-9-927-2017, 2017.
Human Development Index (HDI)
Statistic composite index of life expectancy, education, and per capita income.Sources: [Link] Kummu, M., Taka, M. & Guillaume, J. Gridded global datasets for Gross Domestic Product and Human Development Index over 1990–2015. Sci Data 5, 180004 (2018) doi:10.1038/sdata.2018.4
Sand am Main, Bavaria CO2 Emissions
Carbon Dioxide (CO2) Emissions Per Capita in Tonnes Per Year| Location | CO2 Emissions | CO2 Emissions Per Capita | CO2 Emissions Intensity |
|---|---|---|---|
| Sand am Main, Bavaria | 24,862 tn | 9.29 tn | 14,625 tons/km² |
| Bayern | 124,278,406 tn | 9.81 tn | 1,761 tons/km² |
| Germany | 755,339,039 tn | 9.36 tn | 2,108 tons/km² |
Sand am Main, Bavaria CO2 Emissions
| 2013 CO2 emissions (tonnes/year) | 24,862 tn |
| 2013 CO2 emissions (tonnes/year) per capita | 9.29 tn |
| 2013 CO2 emissions intensity (tonnes/km²/year) | 14,625 tons/km² |
Natural Hazards Risk
Relative risk out of 10| Flood | High (10) |
| Earthquake | Low (2) |
* Risk, particularly concerning flood or landslide, may not be for the entire area.
Sources: 1. Dilley, M., R.S. Chen, U. Deichmann, A.L. Lerner-Lam, M. Arnold, J. Agwe, P. Buys, O. Kjekstad, B. Lyon, and G. Yetman. 2005. Natural Disaster Hotspots: A Global Risk Analysis. Washington, D.C.: World Bank. https://doi.org/10.1596/0-8213-5930-4.
2. Center for Hazards and Risk Research - CHRR - Columbia University, Center for International Earth Science Information Network - CIESIN - Columbia University. 2005. Global Flood Hazard Frequency and Distribution. Palisades, NY: NASA Socioeconomic Data and Applications Center (SEDAC). https://doi.org/10.7927/H4668B3D.
3. Center for Hazards and Risk Research - CHRR - Columbia University, Center for International Earth Science Information Network - CIESIN - Columbia University. 2005. Global Earthquake Hazard Distribution - Peak Ground Acceleration. Palisades, NY: NASA Socioeconomic Data and Applications Center (SEDAC). https://doi.org/10.7927/H4BZ63ZS.
Recent Nearby Earthquakes
Magnitude 3.0 and greater
Sand am Main, Bavaria
Sand is a municipality in the district of Haßberge in Bavaria in Germany. Sand am Main Wikipedia Page
About Our Data
The data on this page is estimated using a number of publicly available tools and resources. It is provided without warranty, and could contain inaccuracies. Use at your own risk. See here for more information.