Businesses in Tarp, Germany
Hotels & Travel
Restaurants
Automotive
Financial Services
Medical
Beauty & Spas
Community & Government
Industries
Business Distribution by Industry Shopping: 18.7%
Professional Services: 11.5%
Industry: 8.7%
Medical: 8.6%
Food: 6.1%
Financial Services: 6%
Beauty & Spas: 5.1%
Home Services: 5.1%
Other: 30.3%
| Industry Description | Number of Establishments | Average Google Rating | Businesses per 1,000 residents |
|---|---|---|---|
| Car repair | 5 | 4.3 | 1.1 |
| Beauty salons | 11 | 4.6 | 2.5 |
| Hairdressers | 10 | 4.6 | 2.3 |
| Loan companies | 14 | 4.2 | 3.2 |
| Bakeries | 8 | 4.3 | 1.8 |
| Grocery stores and supermarkets | 18 | 4.1 | 4.1 |
| General contractors | 8 | 5.0 | 1.8 |
| Other membership organizations | 6 | 5.0 | 1.4 |
| Tractors and farm equipment | 6 | 4.5 | 1.4 |
| Health and medical | 19 | 4.5 | 4.3 |
| Pharmacies and drug stores | 7 | 4.6 | 1.6 |
| Area of Tarp, Germany | 2.63 km² |
| Population | 4,383 |
| Male Population | 2,120 (48.4%) |
| Female Population | 2,263 (51.6%) |
| Population change from 1975 to 2015 | +5% |
| Population change from 2000 to 2015 | -0.9% |
| Median Age | 45.5 |
| Male Median Age | 44.6 |
| Female Median Age | 46.4 |
| Area Codes | 4638 |
| Neighborhoods | Keelbek, Tarpholz, Tornschau |
| Local Time | Friday 4:03 AM |
| Timezone | Central European Summer Time |
| Lat & Lng | 54.66667° / 9.4° |
| Postal Codes | 24963 |
Tarp, Germany - Map
Tarp, Germany Population
Years 1975 to 2015| Data | 1975 | 1990 | 2000 | 2015 |
|---|---|---|---|---|
| Population | 4,174 | 4,197 | 4,421 | 4,383 |
| Population Density | 1,587 / km² | 1,595 / km² | 1,680 / km² | 1,666 / km² |
Tarp, Germany Population change from 2000 to 2015
Decrease of 0.9% from year 2000 to 2015| Location | Change since 1975 | Change since 1990 | Change since 2000 |
|---|---|---|---|
| Tarp, Germany | +5% | +4.4% | -0.9% |
| Schleswig-Holstein | +14.9% | +9.1% | +2.3% |
| Germany | +2.6% | +2.2% | -1.5% |
Tarp, Germany Median Age
Median Age: 45.5 years| Location | Median Age | Median Age (Female) | Median Age (Male) |
|---|---|---|---|
| Tarp, Germany | 45.5 years | 46.4 years | 44.6 years |
| Schleswig-Holstein | 45.3 years | 46.3 years | 44.3 years |
| Germany | 44.8 years | 46 years | 43.6 years |
Tarp, Germany Population Tree
Population By Age and Gender| Age | Male | Female | Total |
|---|---|---|---|
| Under 5 | 94 | 87 | 181 |
| 5-9 | 103 | 103 | 206 |
| 10-14 | 133 | 129 | 263 |
| 15-19 | 137 | 135 | 272 |
| 20-24 | 117 | 103 | 220 |
| 25-29 | 88 | 97 | 185 |
| 30-34 | 103 | 110 | 213 |
| 35-39 | 116 | 124 | 241 |
| 40-44 | 182 | 190 | 372 |
| 45-49 | 192 | 198 | 391 |
| 50-54 | 162 | 167 | 329 |
| 55-59 | 140 | 148 | 288 |
| 60-64 | 138 | 142 | 281 |
| 65-69 | 125 | 131 | 256 |
| 70-74 | 141 | 153 | 294 |
| 75-79 | 79 | 97 | 177 |
| 80-84 | 44 | 73 | 118 |
| 85 Plus | 27 | 76 | 104 |
Tarp, Germany Population Density
Population Density: 1,666 / km²| Location | Population | Area | Population Density |
|---|---|---|---|
| Tarp, Germany | 4,383 | 2.63 km² | 1,666 / km² |
| Schleswig-Holstein | 2.8 million | 15,915.1 km² | 177.4 / km² |
| Germany | 80.7 million | 358,179.8 km² | 225.2 / km² |
Tarp, Germany Historical and Projected Population
Estimated Ancient Population until 2100Sources:
1. JRC (European Commission's Joint Research Centre) work on the GHS built-up grid
2. CIESIN (Center for International Earth Science Information Network)
3. [Link] Klein Goldewijk, K., Beusen, A., Doelman, J., and Stehfest, E.: Anthropogenic land use estimates for the Holocene – HYDE 3.2, Earth Syst. Sci. Data, 9, 927–953, https://doi.org/10.5194/essd-9-927-2017, 2017.
Neighborhoods
Business Distribution by neighborhood in Tarp, Germany Tornschau: 48.4%
Keelbek: 32.3%
Tarpholz: 9.7%
Keelbekfeld: 6.5%
Westliche Höhe: 3.2%
Human Development Index (HDI)
Statistic composite index of life expectancy, education, and per capita income.Sources: [Link] Kummu, M., Taka, M. & Guillaume, J. Gridded global datasets for Gross Domestic Product and Human Development Index over 1990–2015. Sci Data 5, 180004 (2018) doi:10.1038/sdata.2018.4
Tarp, Germany CO2 Emissions
Carbon Dioxide (CO2) Emissions Per Capita in Tonnes Per Year| Location | CO2 Emissions | CO2 Emissions Per Capita | CO2 Emissions Intensity |
|---|---|---|---|
| Tarp, Germany | 41,478 tn | 9.46 tn | 15,771 tons/km² |
| Schleswig-Holstein | 27,326,926 tn | 9.68 tn | 1,717 tons/km² |
| Germany | 755,339,039 tn | 9.36 tn | 2,108 tons/km² |
Tarp, Germany CO2 Emissions
| 2013 CO2 emissions (tonnes/year) | 41,478 tn |
| 2013 CO2 emissions (tonnes/year) per capita | 9.46 tn |
| 2013 CO2 emissions intensity (tonnes/km²/year) | 15,771 tons/km² |

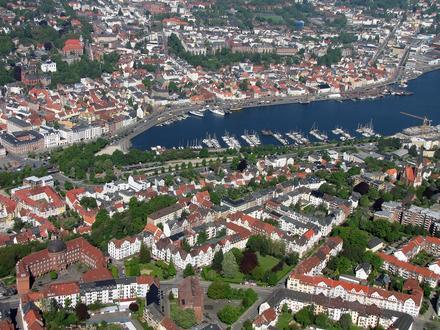
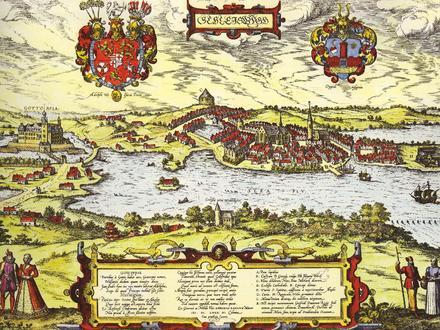
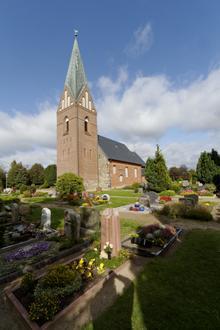
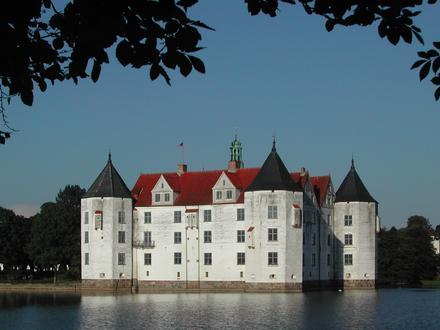
Tarp, Germany
Tarp is a municipality in the district of Schleswig-Flensburg, in Schleswig-Holstein, Germany within the county Kreis Schleswig-Flensburg. is situated about 18 km south of Flensburg. Tarp, Germany Wikipedia Page
About Our Data
The data on this page is estimated using a number of publicly available tools and resources. It is provided without warranty, and could contain inaccuracies. Use at your own risk. See here for more information.