Categories in Nexø
Industries
Business Distribution by Industry in Nexø
| Industry Description | Number of Establishments | Average Age of Business |
|---|---|---|
| Construction of buildings | 72 | — |
| Unreachable | 60 | — |
| Shopping other | 50 | 21 years |
| Shopping | 44 | 29 years |
| Landscaping | 41 | 24 years |
| Restaurants | 40 | 17 years |
| Corporate management | 35 | 21 years |
| Buses and trains | 32 | — |
| Art galleries | 28 | — |
Nexø Facts
| Area | 2.2 km² |
| Population | 3,070 |
| Male Population | 1,457 (47.5%) |
| Female Population | 1,613 (52.5%) |
| Population change (1975 to 2020) | -38.6% |
| Population change (2000 to 2020) | -18.3% |
| Median Age | 47.7 years (Male: 46.8, Female: 48.5) |
| Neighborhoods | Nexø, Snogebæk, Balka, Balka Strand, Østerbros |
| Local Time | |
| Timezone | Central European Summer Time |
| Lat & Lng | 55.06067, 15.13058 |
| Postal Codes | 3730 |
Map of Nexø
Interactive Map
Nexø Population
Years 1975 to 2020
| Data | 1975 | 1990 | 2000 | 2015 | 2020 |
|---|---|---|---|---|---|
| Population | 4,998 | 4,193 | 3,758 | 3,077 | 3,070 |
| Population Density | 2,284.8 / km² | 1,916.8 / km² | 1,717.9 / km² | 1,406.6 / km² | 1,403.4 / km² |
Nexø Population change from 2000 to 2015
Decrease of 18.1% from year 2000 to 2015
| Location | Change since 1975 | Change since 1990 | Change since 2000 |
|---|---|---|---|
| Nexø | -38.4% | -26.6% | -18.1% |
| Capital Region of Denmark | +36.4% | +22.8% | +13.4% |
| Denmark | +12.1% | +10.4% | +6.3% |
Nexø Median Age
Median Age: 47.7 years
| Location | Median Age | Median Age (Female) | Median Age (Male) |
|---|---|---|---|
| Nexø | 47.7 yrs | 48.5 yrs | 46.8 yrs |
| Capital Region of Denmark | 38.9 yrs | 39.7 yrs | 38 yrs |
| Denmark | 40.5 yrs | 41.3 yrs | 39.6 yrs |
Nexø Population Density
Population Density: 1,403 / km²
| Location | Population | Area | Density |
|---|---|---|---|
| Nexø | 3,070 | 2.188 km² | 1,403 / km² |
| Capital Region of Denmark | 1.7 million | 2,602.8 km² | 670 / km² |
| Denmark | 5.5 million | 43,072 km² | 129 / km² |
Nexø Historical and Projected Population
Estimated Population from 0 to 2100
- JRC (European Commission's Joint Research Centre) work on the GHS built-up grid
- CIESIN (Center for International Earth Science Information Network)
- [Link] Klein Goldewijk, K., Beusen, A., Doelman, J., and Stehfest, E.: Anthropogenic land use estimates for the Holocene – HYDE 3.2, Earth Syst. Sci. Data, 9, 927–953, https://doi.org/10.5194/essd-9-927-2017, 2017.
Neighborhoods in Nexø
Percentage of businesses by neighborhood in Nexø
Price Distribution
Business distribution by price for Nexø
Human Development Index (HDI)
Statistic composite index of life expectancy, education, and per capita income.
Nexø CO2 Emissions
Carbon Dioxide (CO2) Emissions Per Capita in Tonnes Per Year
| Location | CO2 Emissions | CO2 Emissions Per Capita | CO2 Emissions Intensity |
|---|---|---|---|
| Nexø | 25,171 tn | 8.2 tn | 11,506.5 tons/km² |
| Capital Region of Denmark | 18,123,923 tn | 10.4 tn | 6,963.3 tons/km² |
| Denmark | 59,647,725 tn | 10.75 tn | 1,384.8 tons/km² |
| 2013 CO2 emissions (tonnes/year) | 25,171 tn |
| 2013 CO2 emissions (tonnes/year) per capita | 8.2 tn |
| 2013 CO2 emissions intensity (tonnes/km²/year) | 11,506.5 tons/km² |
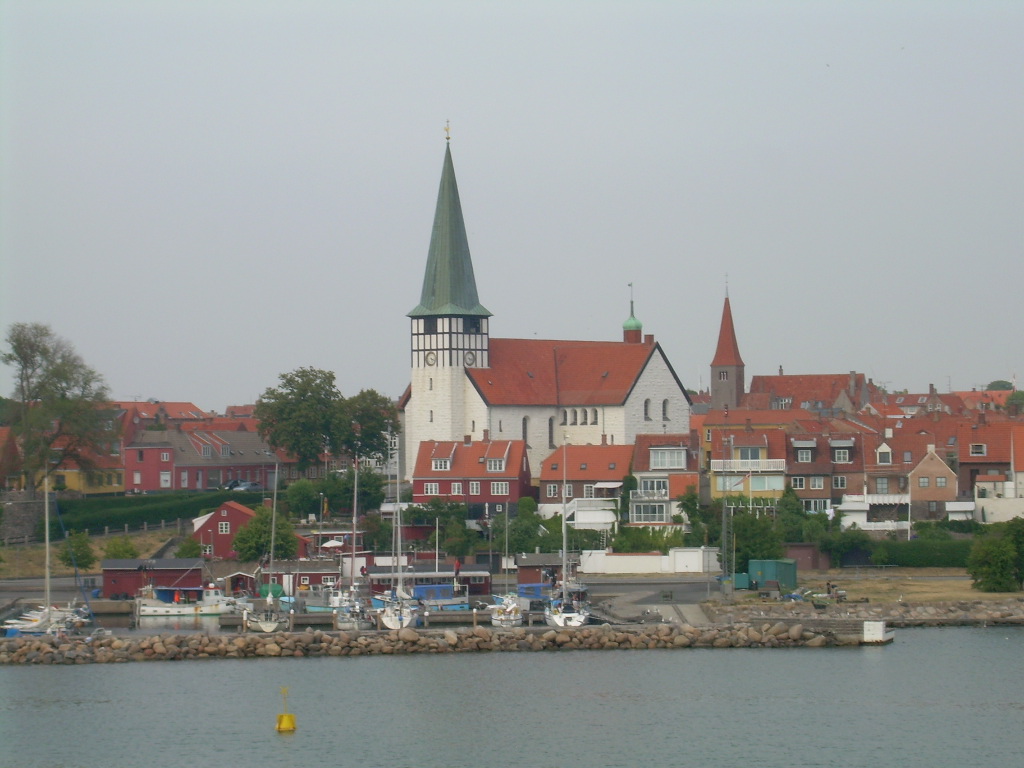
Nexø
Nexø, sometimes spelled Neksø, is a town on the east coast of the Baltic island of Bornholm, Denmark. With a population of 3,642 (as of 1 January 2015), it is the second largest town, as well as the largest fishing port on the island. Fishing is the ..
Nexø Wikipedia Page


About Our Data
The data on this page is estimated using a number of publicly available tools and resources. It is provided without warranty, and could contain inaccuracies. Use at your own risk.