Rø Facts
| Area | 0.2 km² |
| Population | 23 |
| Population change (1975 to 2020) | -68.9% |
| Population change (2000 to 2020) | -43.9% |
| Local Time | |
| Timezone | Central European Summer Time |
| Lat & Lng | 55.21340, 14.89366 |
Map of Rø
Interactive Map
Rø Population
Years 1975 to 2020
| Data | 1975 | 1990 | 2000 | 2015 | 2020 |
|---|---|---|---|---|---|
| Population | 74 | 53 | 41 | 23 | 23 |
| Population Density | 394.7 / km² | 282.7 / km² | 218.7 / km² | 122.7 / km² | 122.7 / km² |
Sources: JRC (European Commission's Joint Research Centre) work on the GHS built-up grid
Rø Population change from 2000 to 2015
Decrease of 43.9% from year 2000 to 2015
| Location | Change since 1975 | Change since 1990 | Change since 2000 |
|---|---|---|---|
| Rø | -68.9% | -56.6% | -43.9% |
| Capital Region of Denmark | +36.4% | +22.8% | +13.4% |
| Denmark | +12.1% | +10.4% | +6.3% |
Sources: JRC (European Commission's Joint Research Centre) work on the GHS built-up grid
Rø Population Density
Population Density: 123 / km²
| Location | Population | Area | Density |
|---|---|---|---|
| Rø | 23 | 0.188 km² | 123 / km² |
| Capital Region of Denmark | 1.7 million | 2,602.8 km² | 670 / km² |
| Denmark | 5.5 million | 43,072 km² | 129 / km² |
Sources: JRC (European Commission's Joint Research Centre) work on the GHS built-up grid
Rø Historical and Projected Population
Estimated Population from 0 to 2100
Sources:
- JRC (European Commission's Joint Research Centre) work on the GHS built-up grid
- CIESIN (Center for International Earth Science Information Network)
- [Link] Klein Goldewijk, K., Beusen, A., Doelman, J., and Stehfest, E.: Anthropogenic land use estimates for the Holocene – HYDE 3.2, Earth Syst. Sci. Data, 9, 927–953, https://doi.org/10.5194/essd-9-927-2017, 2017.
Human Development Index (HDI)
Statistic composite index of life expectancy, education, and per capita income.
Source: [Link] Kummu, M., Taka, M. &Guillaume, J. Gridded global datasets for Gross Domestic Product and Human Development Index over 1990–2015. Sci Data 5, 180004 (2018) doi:10.1038/sdata.2018.4
Rø CO2 Emissions
Carbon Dioxide (CO2) Emissions Per Capita in Tonnes Per Year
| Location | CO2 Emissions | CO2 Emissions Per Capita | CO2 Emissions Intensity |
|---|---|---|---|
| Rø | 245 tn | 10.67 tn | 1,309 tons/km² |
| Capital Region of Denmark | 18,123,923 tn | 10.4 tn | 6,963.3 tons/km² |
| Denmark | 59,647,725 tn | 10.75 tn | 1,384.8 tons/km² |
Sources: [Link] Moran, D., Kanemoto K; Jiborn, M., Wood, R., Többen, J., and Seto, K.C. (2018) Carbon footprints of 13,000 cities. Environmental Research Letters DOI: 10.1088/1748-9326/aac72a
Rø CO2 Emissions
| 2013 CO2 emissions (tonnes/year) | 245 tn |
| 2013 CO2 emissions (tonnes/year) per capita | 10.67 tn |
| 2013 CO2 emissions intensity (tonnes/km²/year) | 1,309 tons/km² |
Recent Nearby Earthquakes
Magnitude 3.0 and greater
| Date▼ | Time↕ | Magnitude↕ | Distance↕ | Depth↕ | Location↕ | Link |
|---|---|---|---|---|---|---|
| 12/16/08 | 5:20 AM | 4.3 | 99.9 km | 10,000 m | Sweden | usgs.gov |
Source: U.S. Geological Survey (USGS)
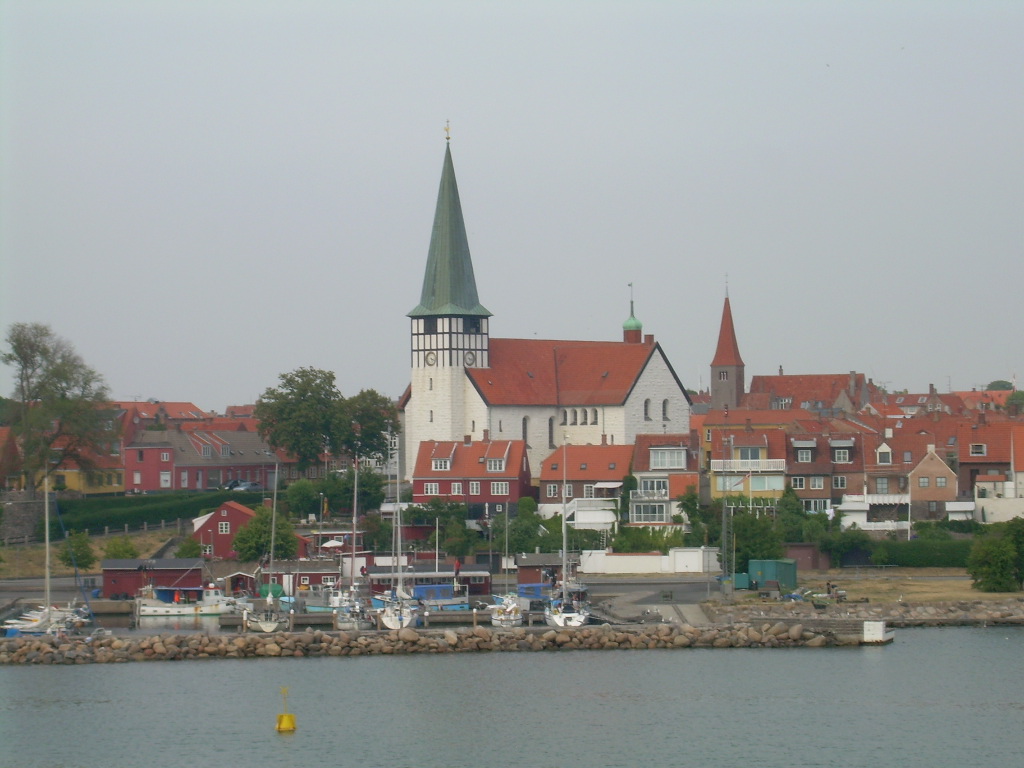
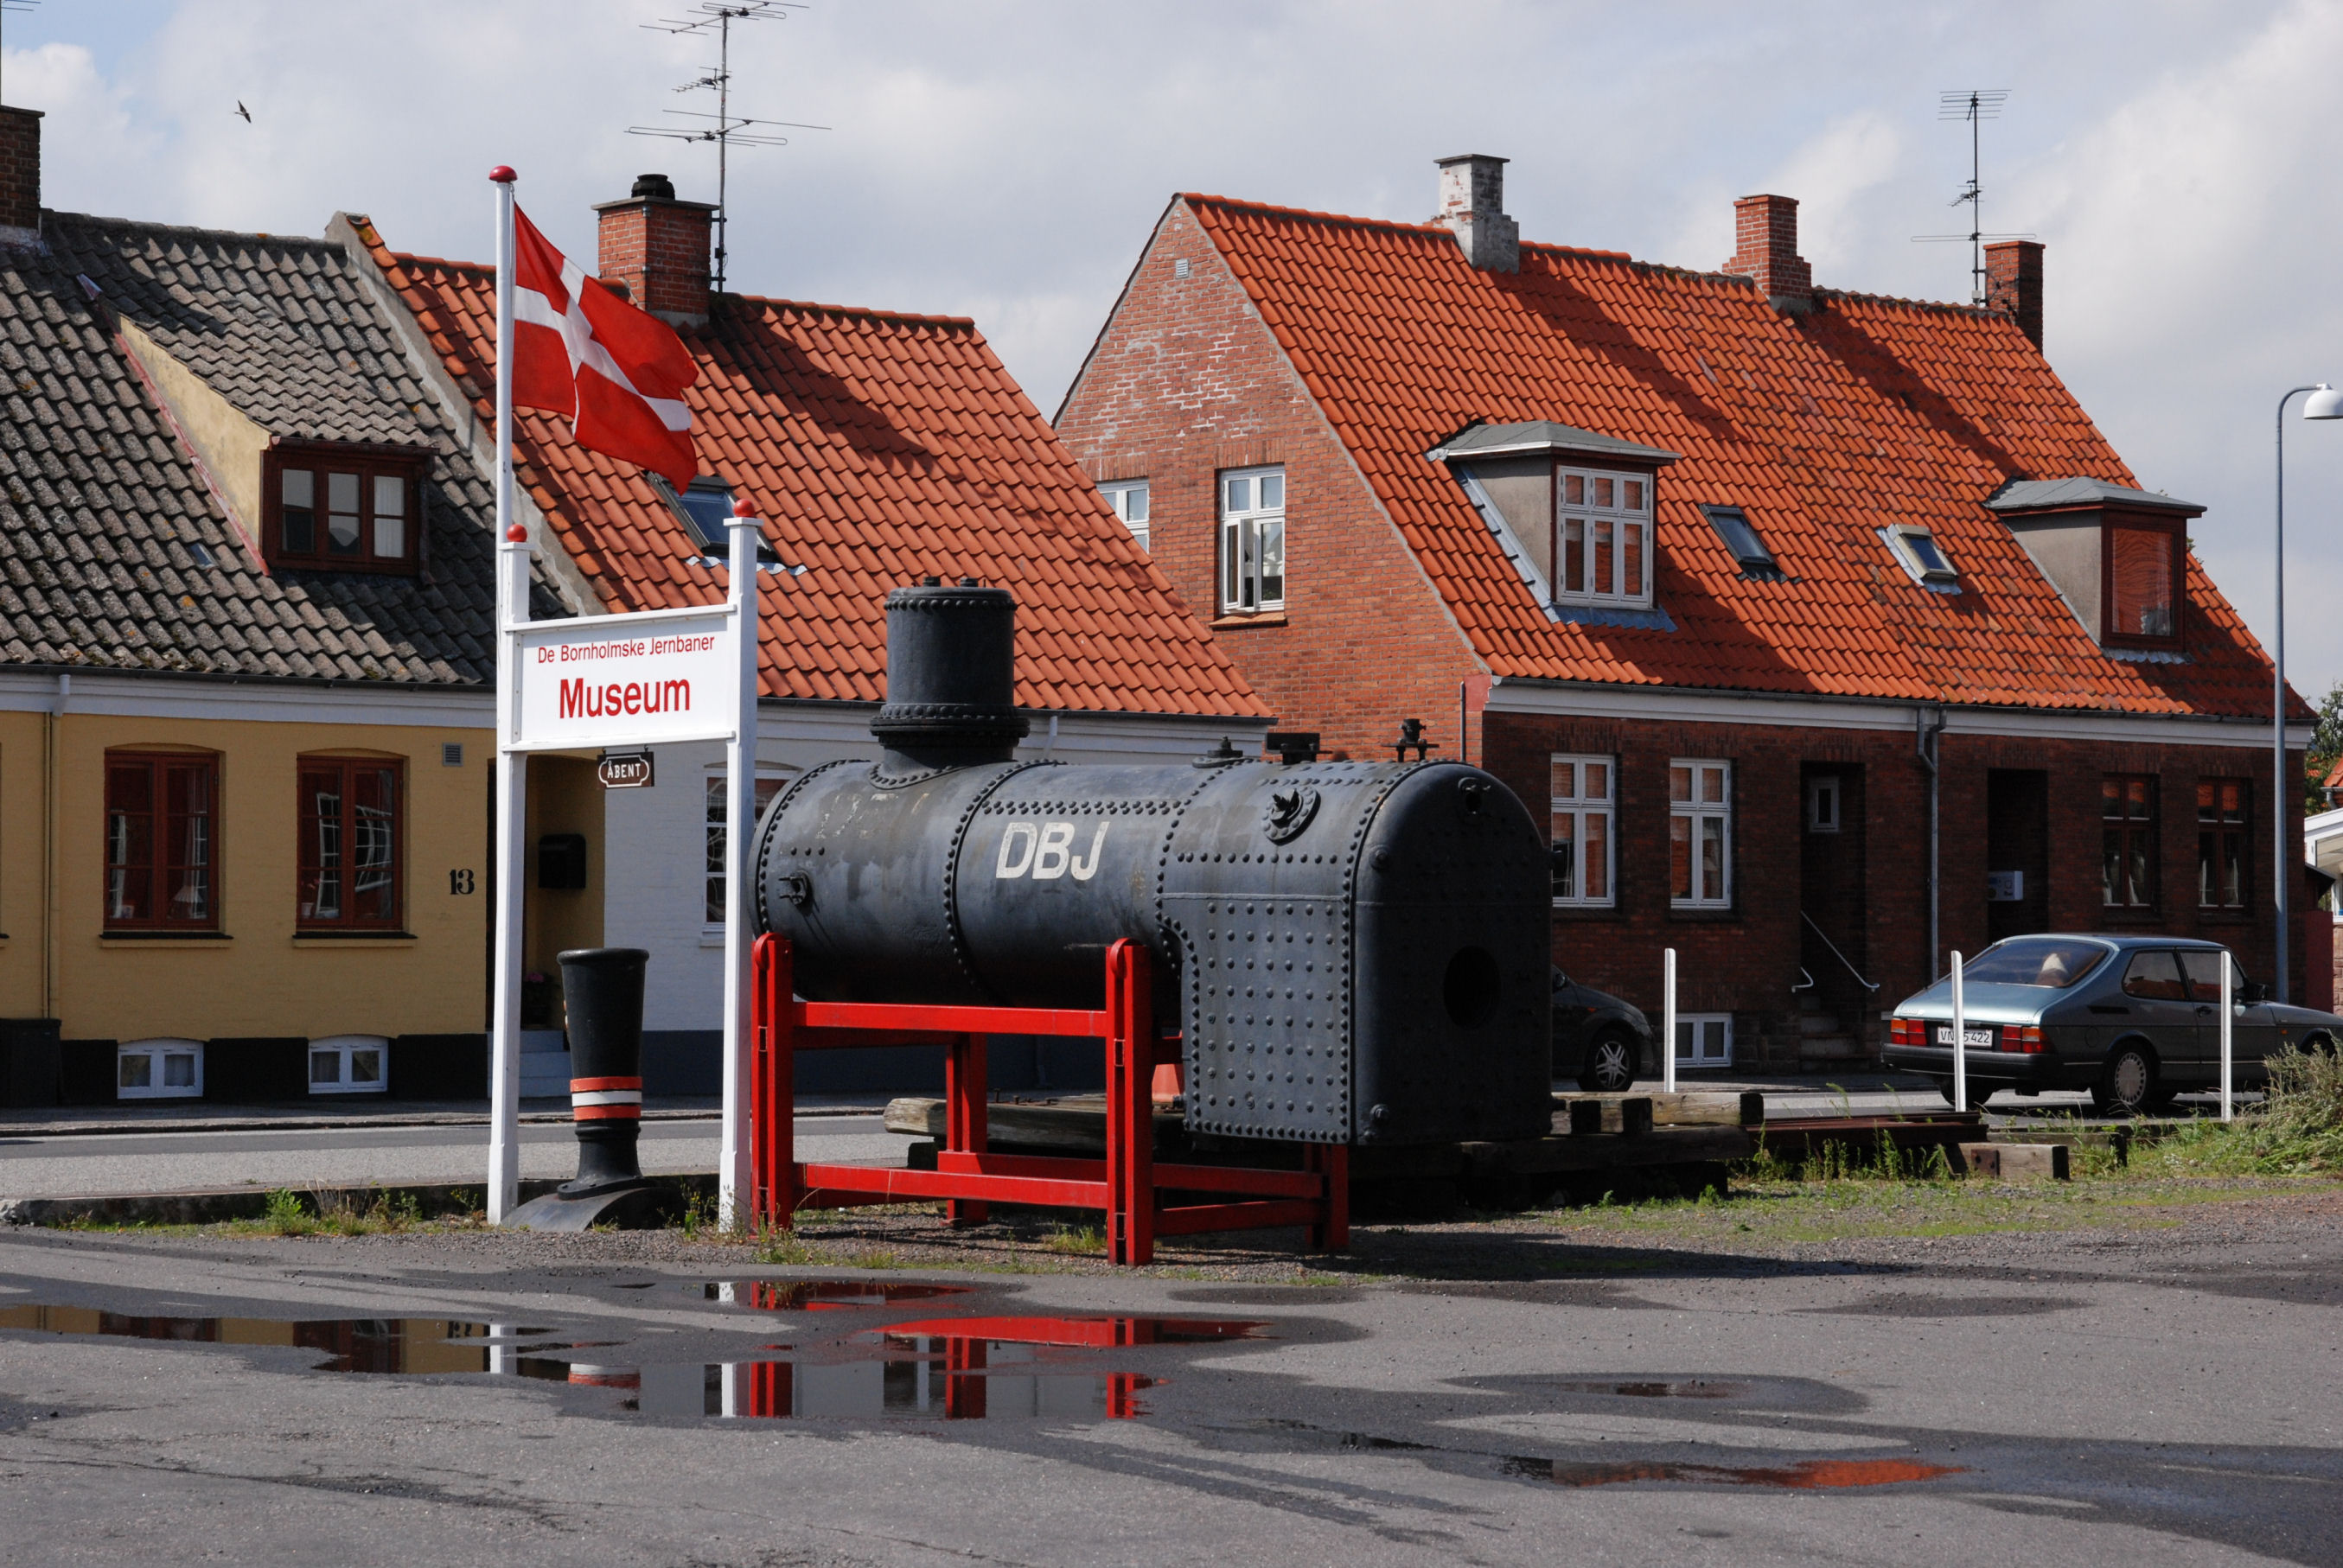
Rø
Rø is a small community on the Danish island of Bornholm, 2 km from the north coast and 7 km west of Gudhjem. The Rønne–Allinge railway (1913–1953) brought prosperity to the village leaving the old station in the village. The Bornholm Art Museum is c..
Rø Wikipedia Page

About Our Data
The data on this page is estimated using a number of publicly available tools and resources. It is provided without warranty, and could contain inaccuracies. Use at your own risk.