- World
- »
- GB
- »
- England
- »
- Northleach, England
Businesses in Northleach
Industries
Business Distribution by Industry Professional Services: 18.8%
Hotels & Travel: 18%
Restaurants: 12%
Home Services: 6.8%
Food: 6%
Medical: 5.3%
Industry: 5.3%
Shopping: 5.3%
Local Services: 4.5%
Community & Government: 4.5%
Other: 13.5%
| Area of Northleach, England | 2.02 km² |
| Population | 1,292 |
| Male Population | 600 (46.5%) |
| Female Population | 692 (53.5%) |
| Population change from 1975 to 2015 | -16.2% |
| Population change from 2000 to 2015 | +0.1% |
| Median Age | 45.4 |
| Male Median Age | 45.2 |
| Female Median Age | 45.6 |
| Local Time | Friday 3:04 AM |
| Timezone | British Summer Time |
| Lat & Lng | 51.82994° / -1.83712° |
| Postal Codes | GL54, OX18 |
Northleach, England - Map
Northleach, England Population
Years 1975 to 2015| Data | 1975 | 1990 | 2000 | 2015 |
|---|---|---|---|---|
| Population | 1,542 | 1,328 | 1,291 | 1,292 |
| Population Density | 763.3 / km² | 657.3 / km² | 639.0 / km² | 639.5 / km² |
Northleach Population change from 2000 to 2015
Increase of 0.1% from year 2000 to 2015| Location | Change since 1975 | Change since 1990 | Change since 2000 |
|---|---|---|---|
| Northleach, England | -16.2% | -2.7% | +0.1% |
| Northleach With Eastington | -5.5% | +0.4% | +1.4% |
| Gloucestershire | +10.6% | +10% | +7.8% |
| United Kingdom | +15.2% | +13.3% | +9.9% |
Northleach, England Median Age
Median Age: 45.4 years| Location | Median Age | Median Age (Female) | Median Age (Male) |
|---|---|---|---|
| Northleach, England | 45.4 years | 45.6 years | 45.2 years |
| Northleach With Eastington | 45.7 years | 46 years | 45.3 years |
| Gloucestershire | 41.9 years | 42.9 years | 40.9 years |
| United Kingdom | 39.6 years | 40.6 years | 38.5 years |
Northleach, England Population Tree
Population By Age and Gender| Age | Male | Female | Total |
|---|---|---|---|
| Under 5 | 35 | 46 | 82 |
| 5-9 | 43 | 31 | 74 |
| 10-14 | 39 | 37 | 77 |
| 15-19 | 20 | 33 | 53 |
| 20-24 | 25 | 19 | 45 |
| 25-29 | 14 | 32 | 46 |
| 30-34 | 34 | 38 | 72 |
| 35-39 | 37 | 53 | 90 |
| 40-44 | 52 | 52 | 104 |
| 45-49 | 39 | 48 | 87 |
| 50-54 | 44 | 43 | 88 |
| 55-59 | 43 | 25 | 68 |
| 60-64 | 57 | 52 | 109 |
| 65-69 | 41 | 46 | 88 |
| 70-74 | 29 | 45 | 75 |
| 75-79 | 22 | 29 | 51 |
| 80-84 | 15 | 31 | 47 |
| 85 Plus | 12 | 33 | 45 |
Northleach, England Population Density
Population Density: 639.5 / km²| Location | Population | Area | Population Density |
|---|---|---|---|
| Northleach, England | 1,292 | 2.02 km² | 639.5 / km² |
| Northleach With Eastington | 1,786 | 16.2 km² | 110.3 / km² |
| Gloucestershire | 875,799 | 3,243.5 km² | 270.0 / km² |
| United Kingdom | 64.5 million | 247,916.6 km² | 260.3 / km² |
Northleach, England Historical Population
Estimated Ancient Population until 2015Sources:
1. JRC (European Commission's Joint Research Centre) work on the GHS built-up grid
2. CIESIN (Center for International Earth Science Information Network)
3. [Link] Klein Goldewijk, K., Beusen, A., Doelman, J., and Stehfest, E.: Anthropogenic land use estimates for the Holocene – HYDE 3.2, Earth Syst. Sci. Data, 9, 927–953, https://doi.org/10.5194/essd-9-927-2017, 2017.
Area Codes
Percentage Area Codes used by businesses in Northleach Area Code 1451: 45.5%
Area Code 1285: 31.8%
Area Code 77: 9.1%
Area Code 1242: 4.5%
Area Code 78: 4.5%
Area Code 79: 4.5%
Human Development Index (HDI)
Statistic composite index of life expectancy, education, and per capita income.Sources: [Link] Kummu, M., Taka, M. & Guillaume, J. Gridded global datasets for Gross Domestic Product and Human Development Index over 1990–2015. Sci Data 5, 180004 (2018) doi:10.1038/sdata.2018.4
Northleach, England CO2 Emissions
Carbon Dioxide (CO2) Emissions Per Capita in Tonnes Per Year| Location | CO2 Emissions | CO2 Emissions Per Capita | CO2 Emissions Intensity |
|---|---|---|---|
| Northleach, England | 18,809 tn | 14.6 tn | 9,310 tons/km² |
| Northleach With Eastington | 26,001 tn | 14.6 tn | 1,605 tons/km² |
| Gloucestershire | 10,912,106 tn | 12.5 tn | 3,364 tons/km² |
| United Kingdom | 735,672,543 tn | 11.4 tn | 2,967 tons/km² |
Northleach, England CO2 Emissions
| 2013 CO2 emissions (tonnes/year) | 18,809 tn |
| 2013 CO2 emissions (tonnes/year) per capita | 14.6 tn |
| 2013 CO2 emissions intensity (tonnes/km²/year) | 9,310 tons/km² |
Natural Hazards Risk
Relative risk out of 10| Flood | High (9) |
* Risk, particularly concerning flood or landslide, may not be for the entire area.
Sources: 1. Dilley, M., R.S. Chen, U. Deichmann, A.L. Lerner-Lam, M. Arnold, J. Agwe, P. Buys, O. Kjekstad, B. Lyon, and G. Yetman. 2005. Natural Disaster Hotspots: A Global Risk Analysis. Washington, D.C.: World Bank. https://doi.org/10.1596/0-8213-5930-4.
2. Center for Hazards and Risk Research - CHRR - Columbia University, Center for International Earth Science Information Network - CIESIN - Columbia University. 2005. Global Flood Hazard Frequency and Distribution. Palisades, NY: NASA Socioeconomic Data and Applications Center (SEDAC). https://doi.org/10.7927/H4668B3D.
Recent Nearby Earthquakes
Magnitude 3.0 and greater| Date | Time | Magnitude | Distance | Depth | Location | Link |
|---|---|---|---|---|---|---|
| 10/26/08 | 11:06 AM | 3.9 | 62.9 km | 9,300 m | England, United Kingdom | usgs.gov |
| 9/22/02 | 8:32 PM | 3.2 | 79.7 km | 9,300 m | England, United Kingdom | usgs.gov |
| 9/22/02 | 4:53 PM | 4.8 | 79.7 km | 9,400 m | England, United Kingdom | usgs.gov |
| 6/20/02 | 10:26 AM | 3.4 | 90.8 km | 14,300 m | Wales-England region, United Kingdom | usgs.gov |
| 2/12/02 | 11:13 AM | 3.5 | 98.9 km | 8,300 m | Wales-England region, United Kingdom | usgs.gov |
| 10/9/01 | 7:52 PM | 3.5 | 99.5 km | 10,000 m | Wales-England region, United Kingdom | usgs.gov |
| 9/22/00 | 9:23 PM | 4 | 52.4 km | 13,100 m | England, United Kingdom | usgs.gov |
| 7/30/99 | 2:31 AM | 3.3 | 95.5 km | 6,400 m | Wales-England region, United Kingdom | usgs.gov |
| 5/11/94 | 6:08 PM | 3.7 | 25.4 km | 10,000 m | England, United Kingdom | usgs.gov |
| 9/16/93 | 6:39 PM | 3.2 | 74.6 km | 10,000 m | England, United Kingdom | usgs.gov |
Find historical earthquake occurrences near Northleach, England
Earliest Date Latest Date
Magnitude 3.0 and greater Magnitude 4.0 and greater Magnitude 5.0 and greater

Northleach, England
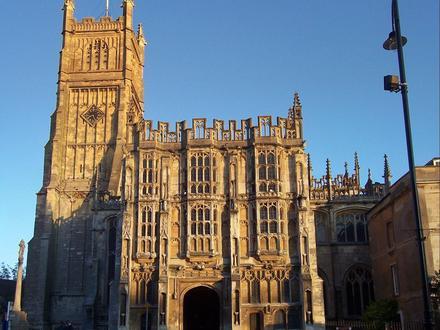
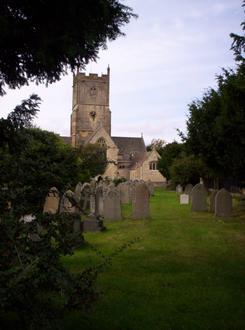
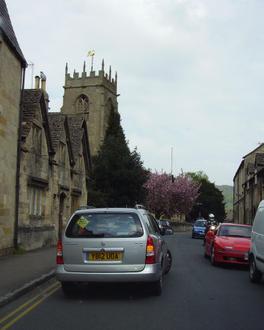
is a market town in Northleach with Eastington civil parish in Gloucestershire, England. The town is in the valley of the River Leach in the Cotswolds, about 10 miles (16 km) northeast of Cirencester and 11 miles (18 km) east-southeast of Cheltenha.. Northleach Wikipedia Page
About Our Data
The data on this page is estimated using a number of publicly available tools and resources. It is provided without warranty, and could contain inaccuracies. Use at your own risk. See here for more information.