Igaliku Facts
| Area | 4.3 km² |
| Population | 40 |
| Male Population | 21 (52.8%) |
| Female Population | 19 (47.2%) |
| Population change (1975 to 2015) | +2.6% |
| Population change (2000 to 2015) | -25.9% |
| Median Age | 50.2 years (Male: 52.5, Female: 48.7) |
| Local Time | |
| Timezone | Greenland Summer Time |
| Lat & Lng | 60.98766, -45.42070 |
Map of Igaliku
Interactive Map
Igaliku Population
Years 1975 to 2015
| Data | 1975 | 1990 | 2000 | 2015 |
|---|---|---|---|---|
| Population | 39 | 65 | 54 | 40 |
| Population Density | 9.2 / km² | 15.3 / km² | 12.7 / km² | 9.4 / km² |
Igaliku Population change from 2000 to 2015
Decrease of 25.9% from year 2000 to 2015
| Location | Change since 1975 | Change since 1990 | Change since 2000 |
|---|---|---|---|
| Igaliku | +2.6% | -38.5% | -25.9% |
| Kujalleq | +81.5% | -8.9% | -6.9% |
| Greenland | -6.7% | +16.2% | +0.2% |
Igaliku Median Age
Median Age: 50.2 years
| Location | Median Age | Median Age (Female) | Median Age (Male) |
|---|---|---|---|
| Igaliku | 50.2 yrs | 48.7 yrs | 52.5 yrs |
| Kujalleq | 37.9 yrs | 36 yrs | 39.5 yrs |
| Greenland | 33.6 yrs | 32.1 yrs | 35 yrs |
Igaliku Population Density
Population Density: 9.4 / km²
| Location | Population | Area | Density |
|---|---|---|---|
| Igaliku | 40 | 4.25 km² | 9.4 / km² |
| Kujalleq | 3,265 | 51,539.1 km² | 0.1 / km² |
| Greenland | 34,483 | 2,165,628.3 km² | 0 / km² |
Igaliku Historical and Projected Population
Estimated Population from 1000 to 2015
- JRC (European Commission's Joint Research Centre) work on the GHS built-up grid
- CIESIN (Center for International Earth Science Information Network)
- [Link] Klein Goldewijk, K., Beusen, A., Doelman, J., and Stehfest, E.: Anthropogenic land use estimates for the Holocene – HYDE 3.2, Earth Syst. Sci. Data, 9, 927–953, https://doi.org/10.5194/essd-9-927-2017, 2017.
Human Development Index (HDI)
Statistic composite index of life expectancy, education, and per capita income.
Igaliku CO2 Emissions
Carbon Dioxide (CO2) Emissions Per Capita in Tonnes Per Year
| Location | CO2 Emissions | CO2 Emissions Per Capita | CO2 Emissions Intensity |
|---|---|---|---|
| Igaliku | 969 tn | 24.23 tn | 228 tons/km² |
| Kujalleq | 75,804 tn | 23.22 tn | 1.5 tons/km² |
| Greenland | 813,754 tn | 23.6 tn | 0.4 tons/km² |
| 2013 CO2 emissions (tonnes/year) | 969 tn |
| 2013 CO2 emissions (tonnes/year) per capita | 24.23 tn |
| 2013 CO2 emissions intensity (tonnes/km²/year) | 228 tons/km² |
Recent Nearby Earthquakes
Magnitude 3.0 and greater
| Date▼ | Time↕ | Magnitude↕ | Distance↕ | Depth↕ | Location↕ | Link |
|---|---|---|---|---|---|---|
| 6/25/18 | 8:55 PM | 4 | 79.8 km | 10,590 m | 99km NE of Nanortalik, Greenland | usgs.gov |
| 8/30/16 | 5:57 AM | 4.3 | 94.4 km | 10,000 m | 116km NE of Nanortalik, Greenland | usgs.gov |
| 9/26/15 | 4:51 AM | 4.7 | 76.3 km | 10,470 m | 88km NE of Nanortalik, Greenland | usgs.gov |
| 11/8/13 | 9:38 AM | 4.4 | 81.3 km | 10,000 m | 109km NE of Nanortalik, Greenland | usgs.gov |
| 4/11/13 | 11:02 PM | 4.6 | 86 km | 11,300 m | 93km NE of Nanortalik, Greenland | usgs.gov |
| 1/21/13 | 6:15 PM | 4.5 | 82.3 km | 10,000 m | 94km NE of Nanortalik, Greenland | usgs.gov |
| 10/25/12 | 11:19 AM | 4.6 | 86.4 km | 10,000 m | western Greenland | usgs.gov |
| 8/16/06 | 9:18 AM | 4.3 | 81.7 km | 10,000 m | western Greenland | usgs.gov |
| 12/24/05 | 7:42 AM | 4.1 | 72.3 km | 10,000 m | western Greenland | usgs.gov |
| 12/22/05 | 2:21 AM | 4.4 | 75.1 km | 10,000 m | western Greenland | usgs.gov |
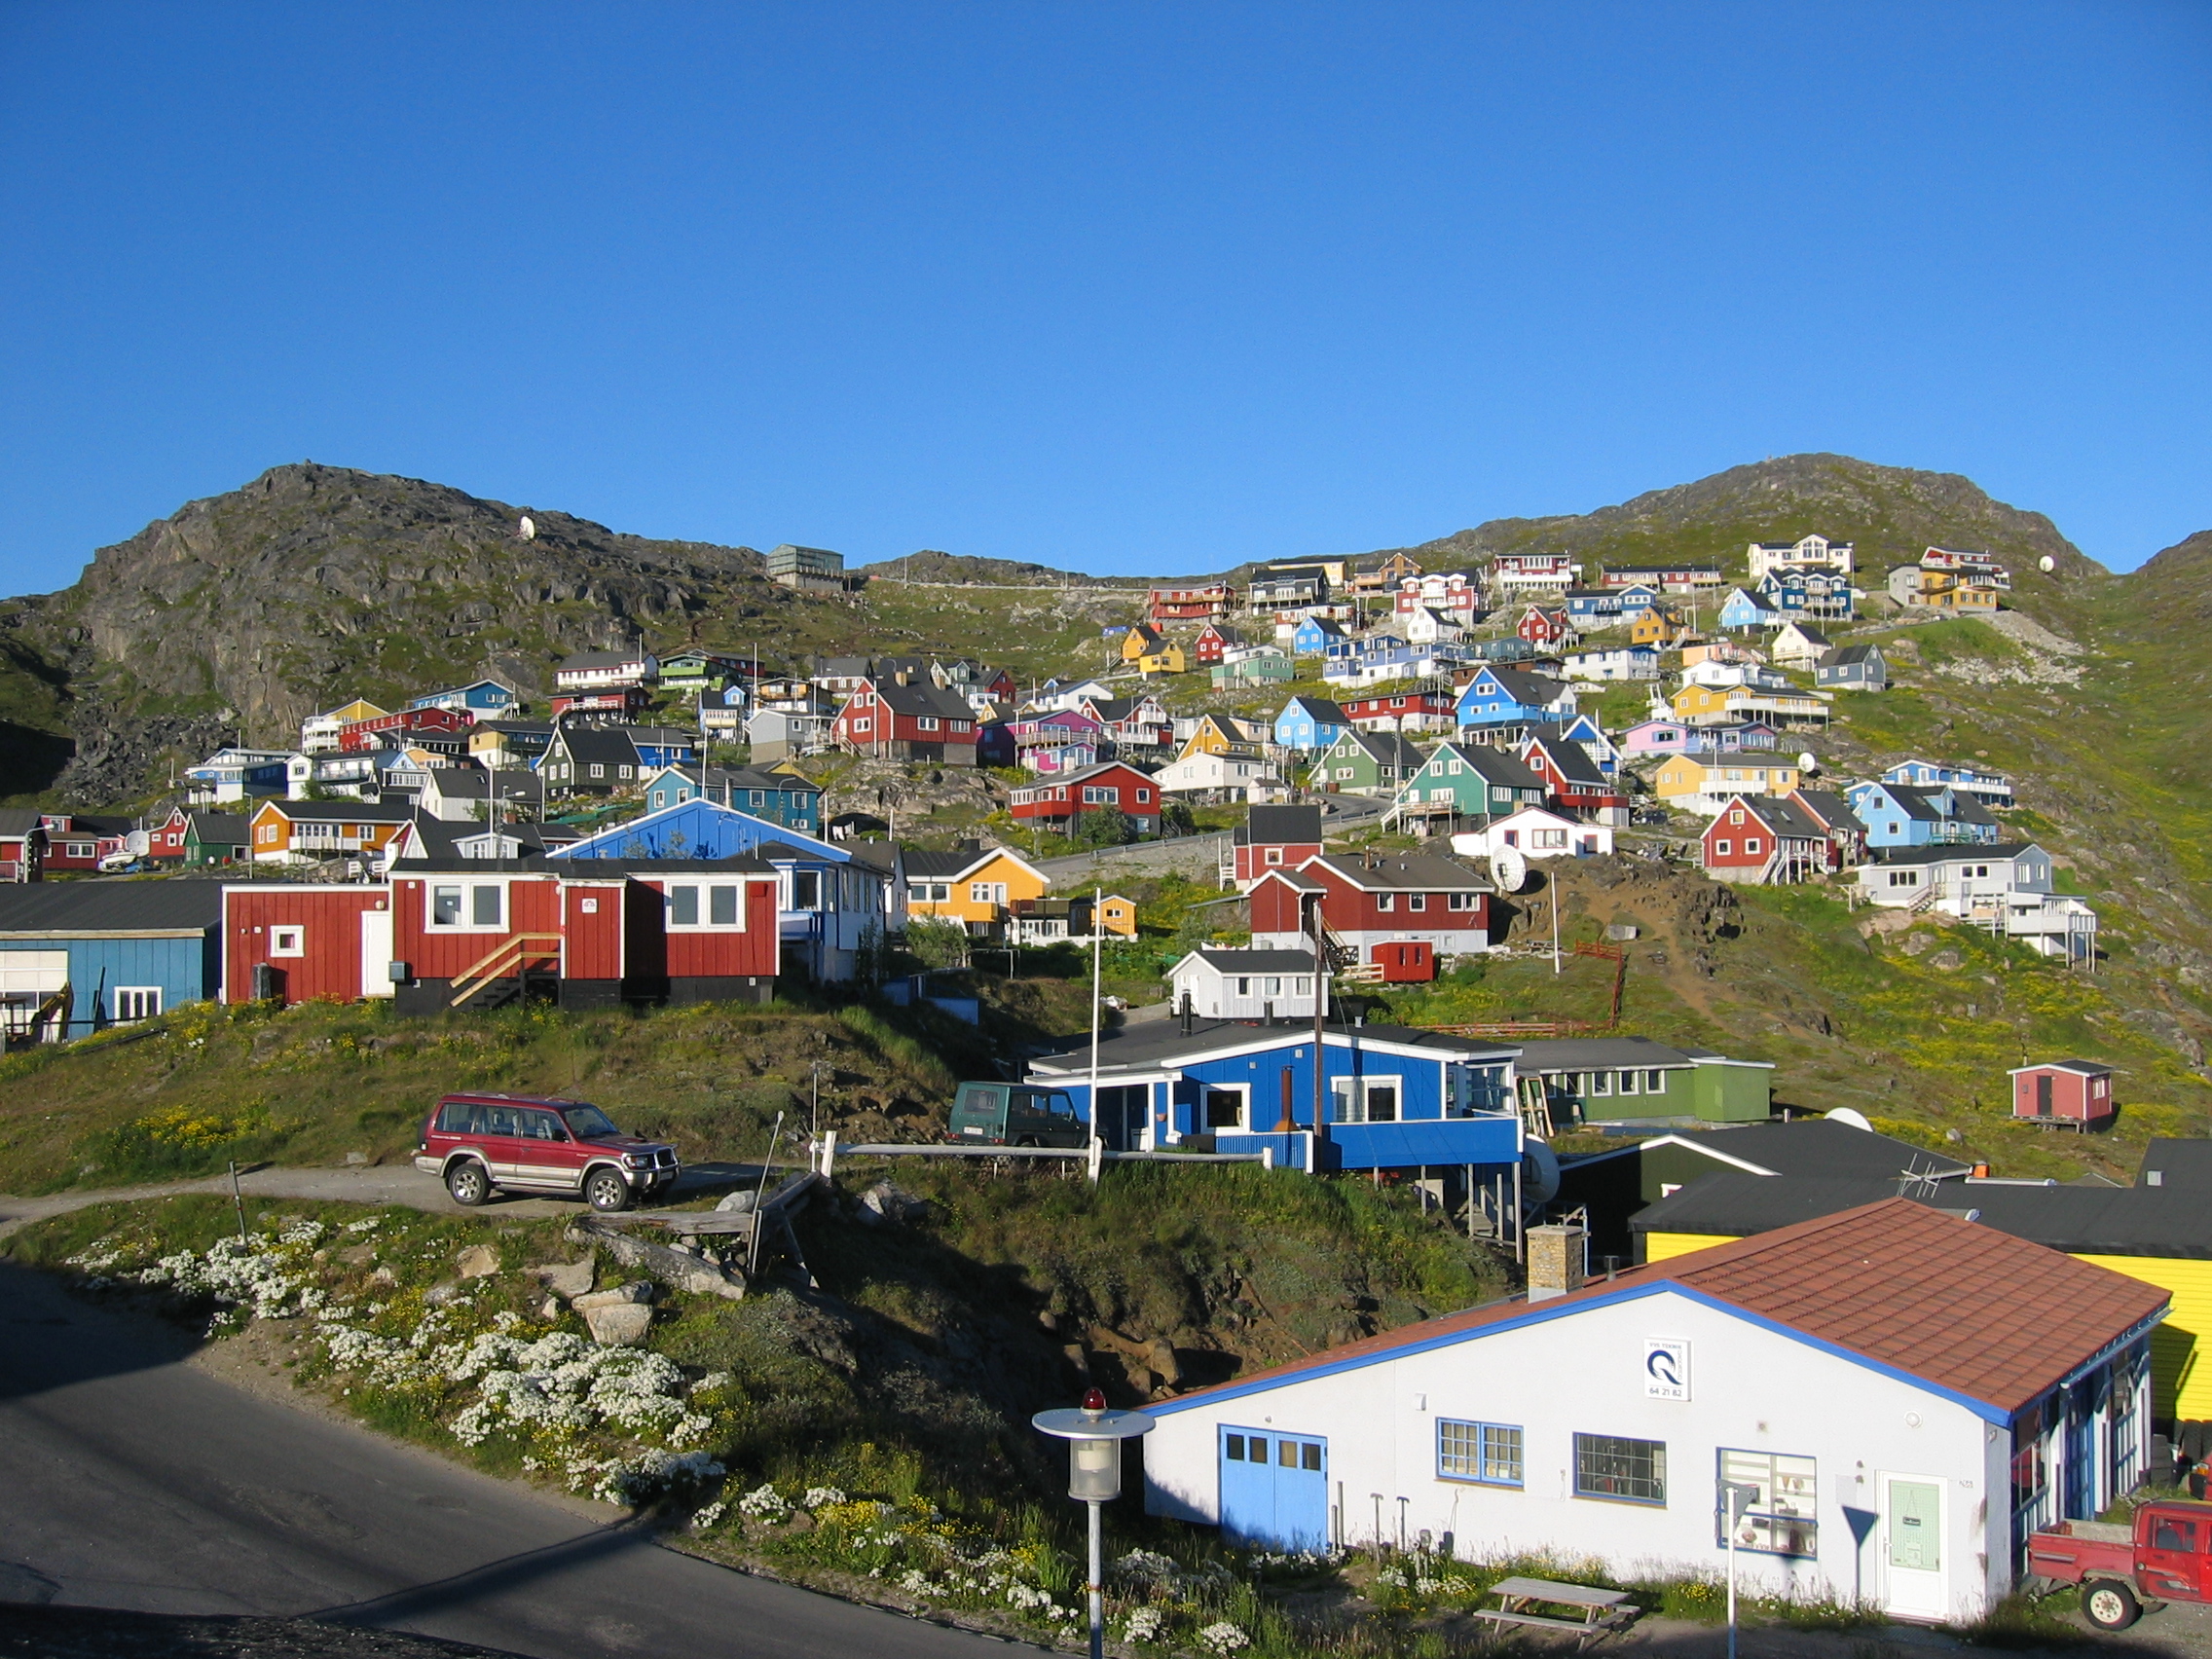
Igaliku
Igaliku (IATA: QFX) is a settlement in the Kujalleq municipality in southern Greenland. The town was founded as Igaliko in 1783 by the trader and colonial administrator Anders Olsen and his wife Tuperna, who was a Greenlander. In 2010, Igaliku had 55..
Igaliku Wikipedia Page


About Our Data
The data on this page is estimated using a number of publicly available tools and resources. It is provided without warranty, and could contain inaccuracies. Use at your own risk.