Categories in Rab
Industries
Business Distribution by Industry in Rab
| Industry Description | Number of Establishments |
|---|---|
| Other accommodation | 314 |
| Real estate | 188 |
| Restaurants | 77 |
| Hotels and motels | 63 |
| Holiday homes, cabins and resorts | 62 |
| Shopping | 27 |
| Bars, pubs and taverns | 26 |
| Rental equipment | 23 |
| Cafes | 22 |
Rab Facts
| Area | 86.1 km² |
| Population | 5,446 |
| Male Population | 2,677 (49.2%) |
| Female Population | 2,769 (50.8%) |
| Population change (1975 to 2020) | -41.2% |
| Population change (2000 to 2020) | -22.6% |
| Median Age | 44.6 years (Male: 43.5, Female: 45.6) |
| Neighborhoods | Banjol, Palit, Supetarska draga |
| Local Time | |
| Timezone | Central European Summer Time |
| Lat & Lng | 44.75694, 14.76083 |
| Postal Codes | 51280 |
Map of Rab
Interactive Map
Rab Population
Years 1975 to 2020
| Data | 1975 | 1990 | 2000 | 2015 | 2020 |
|---|---|---|---|---|---|
| Population | 9,266 | 8,489 | 7,035 | 5,599 | 5,446 |
| Population Density | 107.6 / km² | 98.6 / km² | 81.7 / km² | 65 / km² | 63.2 / km² |
Rab Population change from 2000 to 2015
Decrease of 20.4% from year 2000 to 2015
| Location | Change since 1975 | Change since 1990 | Change since 2000 |
|---|---|---|---|
| Rab | -39.6% | -34% | -20.4% |
| Primorje-Gorski Kotar County | -6.4% | -10.7% | -3.4% |
| Croatia | -6.1% | -11.4% | -4.3% |
Rab Median Age
Median Age: 44.6 years
| Location | Median Age | Median Age (Female) | Median Age (Male) |
|---|---|---|---|
| Rab | 44.6 yrs | 45.6 yrs | 43.5 yrs |
| Primorje-Gorski Kotar County | 45.1 yrs | 46.8 yrs | 43.1 yrs |
| Croatia | 42 yrs | 44.1 yrs | 40 yrs |
Rab Population Density
Population Density: 63.2 / km²
| Location | Population | Area | Density |
|---|---|---|---|
| Rab | 5,446 | 86.1 km² | 63.2 / km² |
| Primorje-Gorski Kotar County | 289,697 | 3,576.8 km² | 81 / km² |
| Croatia | 4.2 million | 56,366.2 km² | 73.9 / km² |
Rab Historical and Projected Population
Estimated Population from 1300 to 2100
- JRC (European Commission's Joint Research Centre) work on the GHS built-up grid
- CIESIN (Center for International Earth Science Information Network)
- [Link] Klein Goldewijk, K., Beusen, A., Doelman, J., and Stehfest, E.: Anthropogenic land use estimates for the Holocene – HYDE 3.2, Earth Syst. Sci. Data, 9, 927–953, https://doi.org/10.5194/essd-9-927-2017, 2017.
Area Codes
Percentage Area Codes used by businesses in Rab
Price Distribution
Business distribution by price for Rab
Human Development Index (HDI)
Statistic composite index of life expectancy, education, and per capita income.
Rab CO2 Emissions
Carbon Dioxide (CO2) Emissions Per Capita in Tonnes Per Year
| Location | CO2 Emissions | CO2 Emissions Per Capita | CO2 Emissions Intensity |
|---|---|---|---|
| Rab | 25,448 tn | 4.67 tn | 295.5 tons/km² |
| Primorje-Gorski Kotar County | 1,742,251 tn | 6.01 tn | 487.1 tons/km² |
| Croatia | 23,288,703 tn | 5.59 tn | 413.2 tons/km² |
| 2013 CO2 emissions (tonnes/year) | 25,448 tn |
| 2013 CO2 emissions (tonnes/year) per capita | 4.67 tn |
| 2013 CO2 emissions intensity (tonnes/km²/year) | 295.5 tons/km² |
Natural Hazards Risk
Relative risk out of 10
| Hazard | Risk Level |
|---|---|
| Flood | Medium (4) |
| Earthquake | Medium (4.4) |
| Landslide | Medium (6) |
* Risk, particularly concerning flood or landslide, may not be for the entire area.
- Dilley, M., R.S. Chen, U. Deichmann, A.L. Lerner-Lam, M. Arnold, J. Agwe, P. Buys, O. Kjekstad, B. Lyon, and G. Yetman. 2005. Natural Disaster Hotspots: A Global Risk Analysis. Washington, D.C.: World Bank. https://doi.org/10.1596/0-8213-5930-4.
- Center for Hazards and Risk Research - CHRR - Columbia University, Center for International Earth Science Information Network - CIESIN - Columbia University, and Norwegian Geotechnical Institute - NGI. 2005. Global Landslide Hazard Distribution. Palisades, NY: NASA Socioeconomic Data and Applications Center (SEDAC). https://doi.org/10.7927/H4P848VZ.
- Center for Hazards and Risk Research - CHRR - Columbia University, Center for International Earth Science Information Network - CIESIN - Columbia University. 2005. Global Flood Hazard Frequency and Distribution. Palisades, NY: NASA Socioeconomic Data and Applications Center (SEDAC). https://doi.org/10.7927/H4668B3D.
- Center for Hazards and Risk Research - CHRR - Columbia University, Center for International Earth Science Information Network - CIESIN - Columbia University. 2005. Global Earthquake Hazard Distribution - Peak Ground Acceleration. Palisades, NY: NASA Socioeconomic Data and Applications Center (SEDAC). https://doi.org/10.7927/H4BZ63ZS.
Recent Nearby Earthquakes
Magnitude 3.0 and greater
| Date▼ | Time↕ | Magnitude↕ | Distance↕ | Depth↕ | Location↕ | Link |
|---|---|---|---|---|---|---|
| 8/8/17 | 9:35 AM | 4 | 51.1 km | 10,000 m | 3km E of Omisalj, Croatia | usgs.gov |
| 5/8/16 | 1:45 AM | 3.3 | 46 km | 6,280 m | 8km NNE of Otocac, Croatia | usgs.gov |
| 7/30/13 | 12:58 PM | 4.4 | 40.5 km | 11,100 m | 16km NNW of Brinje, Croatia | usgs.gov |
| 5/6/11 | 11:44 PM | 4 | 34.7 km | 9,000 m | Croatia | usgs.gov |
| 10/6/08 | 9:19 AM | 3.3 | 62.9 km | 10,000 m | Slovenia-Croatia border region | usgs.gov |
| 12/17/07 | 1:14 PM | 3.8 | 82.6 km | 10,000 m | Adriatic Sea | usgs.gov |
| 12/15/07 | 10:12 PM | 3 | 34.4 km | 10,000 m | Slovenia-Croatia border region | usgs.gov |
| 6/10/07 | 8:48 PM | 3.2 | 63 km | 10,000 m | Croatia | usgs.gov |
| 2/5/07 | 8:30 AM | 4.9 | 41 km | 10,000 m | Croatia | usgs.gov |
| 10/31/06 | 2:45 PM | 3.2 | 56.7 km | 10,000 m | Croatia | usgs.gov |
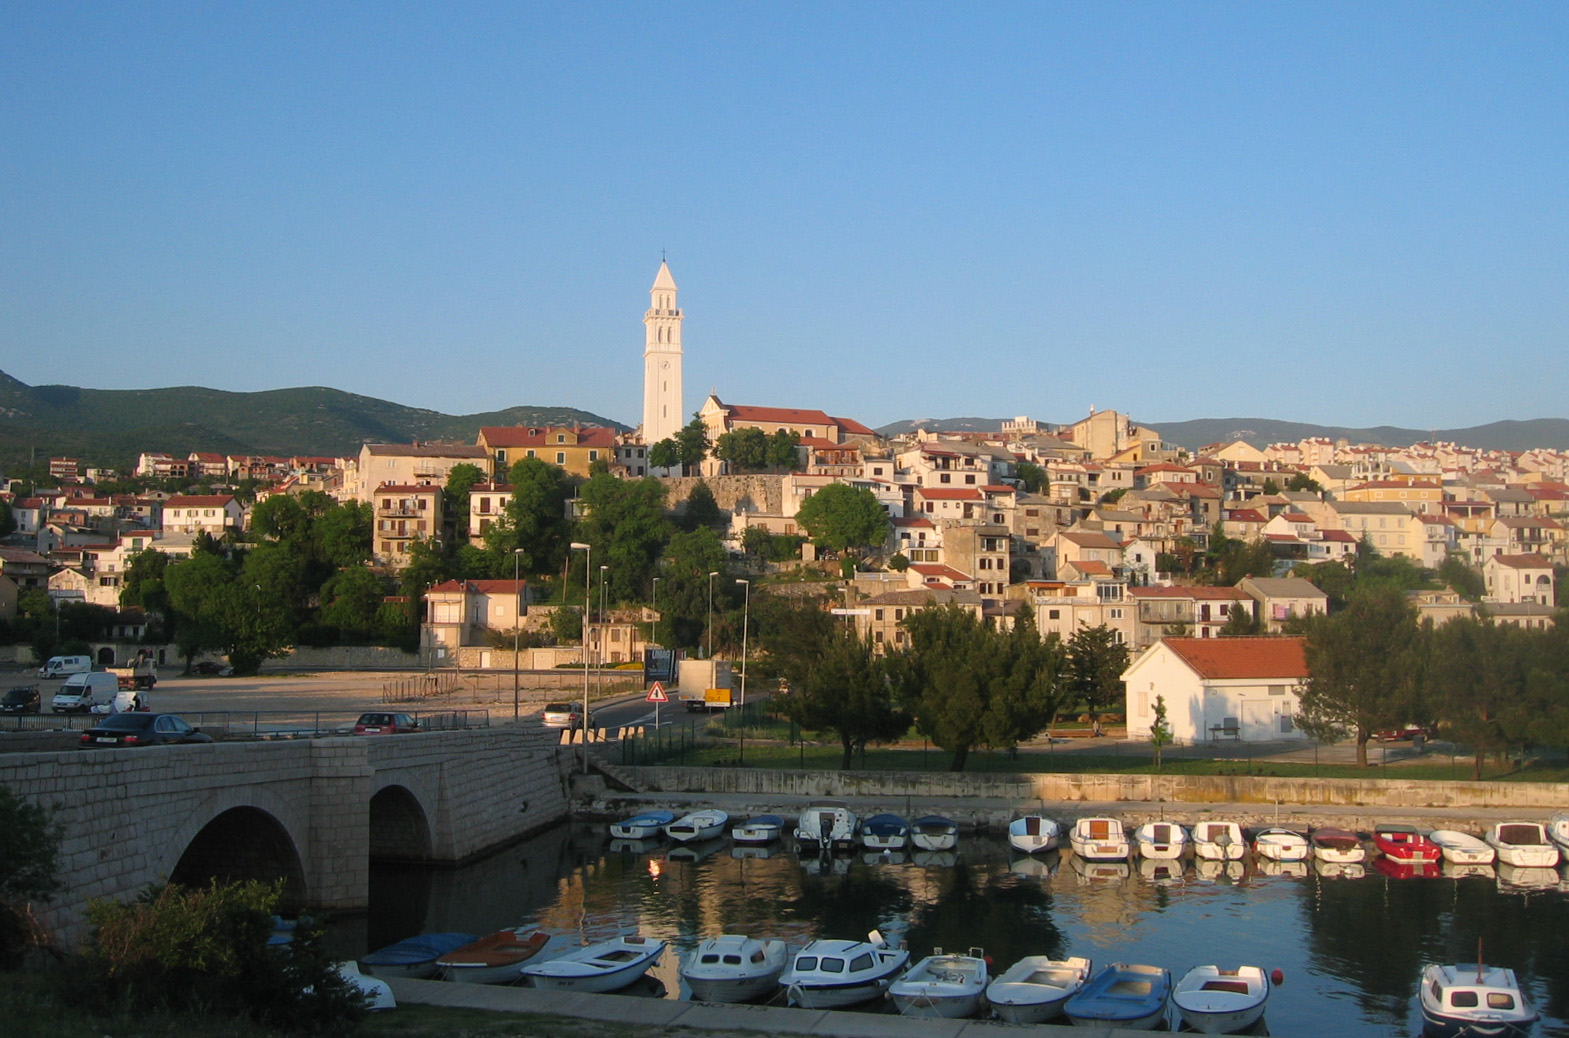
Rab
Rab (Latin: Arba, Italian: Arbe, German: Arbey) is an island in Croatia and a town of the same name located just off the northern Croatian coast in the Adriatic Sea. island is 22 km (14 mi) long, has an area of 93.6 km2 (36 sq mi) and 9,328 inhabita..
Rab Wikipedia Page


About Our Data
The data on this page is estimated using a number of publicly available tools and resources. It is provided without warranty, and could contain inaccuracies. Use at your own risk.