Businesses in Avdon
Industries
Business Distribution by Industry Hotels & Travel: 57.3%
Shopping: 7.3%
Industry: 6.2%
Home Services: 5.2%
Entertainment: 4.2%
Sports & Activities: 4.2%
Other: 15.6%
| Area of Avdon, Northern District (Israel) | 1.166 km² |
| Population | 1,014 |
| Male Population | 512 (50.5%) |
| Female Population | 502 (49.5%) |
| Population change from 1975 to 2015 | +144.9% |
| Population change from 2000 to 2015 | +66.2% |
| Median Age | 26.7 |
| Male Median Age | 26 |
| Female Median Age | 27.4 |
| Area Codes | 4 |
| Local Time | Sunday 7:57 AM |
| Timezone | Israel Daylight Time |
| Lat & Lng | 33.04789° / 35.17995° |
| Postal Codes | 25260 |
Avdon, Northern District (Israel) - Map
Avdon, Northern District (Israel) Population
Years 1975 to 2015| Data | 1975 | 1990 | 2000 | 2015 |
|---|---|---|---|---|
| Population | 414 | 544 | 610 | 1,014 |
| Population Density | 355.1 / km² | 466.6 / km² | 523.2 / km² | 869.6 / km² |
Avdon Population change from 2000 to 2015
Increase of 66.2% from year 2000 to 2015| Location | Change since 1975 | Change since 1990 | Change since 2000 |
|---|---|---|---|
| Avdon, Northern District (Israel) | +144.9% | +86.4% | +66.2% |
| Northern | +142.6% | +78.8% | +33.6% |
| Israel | +141.5% | +78.8% | +33.8% |
Avdon, Northern District (Israel) Median Age
Median Age: 26.7 years| Location | Median Age | Median Age (Female) | Median Age (Male) |
|---|---|---|---|
| Avdon, Northern District (Israel) | 26.7 years | 27.4 years | 26 years |
| Northern | 26.9 years | 27.7 years | 26.2 years |
| Israel | 29.6 years | 30.6 years | 28.5 years |
Avdon, Northern District (Israel) Population Tree
Population By Age and Gender| Age | Male | Female | Total |
|---|---|---|---|
| Under 5 | 50 | 47 | 97 |
| 5-9 | 54 | 51 | 105 |
| 10-14 | 52 | 49 | 101 |
| 15-19 | 49 | 48 | 98 |
| 20-24 | 44 | 39 | 84 |
| 25-29 | 38 | 37 | 75 |
| 30-34 | 38 | 37 | 76 |
| 35-39 | 35 | 36 | 72 |
| 40-44 | 33 | 32 | 66 |
| 45-49 | 29 | 30 | 60 |
| 50-54 | 25 | 24 | 50 |
| 55-59 | 20 | 20 | 41 |
| 60-64 | 14 | 14 | 28 |
| 65-69 | 10 | 11 | 22 |
| 70-74 | 9 | 10 | 20 |
| 75-79 | 6 | 7 | 13 |
| 80-84 | 4 | 6 | 10 |
| 85 Plus | 3 | 4 | 8 |
Avdon, Northern District (Israel) Population Density
Population Density: 869.6 / km²| Location | Population | Area | Population Density |
|---|---|---|---|
| Avdon, Northern District (Israel) | 1,014 | 1.166 km² | 869.6 / km² |
| Northern | 1.4 million | 4,641.2 km² | 303.9 / km² |
| Israel | 8.3 million | 22,078 km² | 374.2 / km² |
Avdon, Northern District (Israel) Historical and Projected Population
Estimated Ancient Population until 2100Sources:
1. JRC (European Commission's Joint Research Centre) work on the GHS built-up grid
2. CIESIN (Center for International Earth Science Information Network)
3. [Link] Klein Goldewijk, K., Beusen, A., Doelman, J., and Stehfest, E.: Anthropogenic land use estimates for the Holocene – HYDE 3.2, Earth Syst. Sci. Data, 9, 927–953, https://doi.org/10.5194/essd-9-927-2017, 2017.
Area Codes
Percentage Area Codes used by businesses in Avdon Area Code 52: 40.7%
Area Code 77: 22.2%
Area Code 53: 14.8%
Area Code 4: 11.1%
Area Code 50: 7.4%
Area Code 2: 3.7%
Human Development Index (HDI)
Statistic composite index of life expectancy, education, and per capita income.Sources: [Link] Kummu, M., Taka, M. & Guillaume, J. Gridded global datasets for Gross Domestic Product and Human Development Index over 1990–2015. Sci Data 5, 180004 (2018) doi:10.1038/sdata.2018.4
Avdon, Northern District (Israel) CO2 Emissions
Carbon Dioxide (CO2) Emissions Per Capita in Tonnes Per Year| Location | CO2 Emissions | CO2 Emissions Per Capita | CO2 Emissions Intensity |
|---|---|---|---|
| Avdon, Northern District (Israel) | 10,229 tn | 10.1 tn | 8,773 tons/km² |
| Northern | 11,734,869 tn | 8.32 tn | 2,528 tons/km² |
| Israel | 81,985,470 tn | 9.92 tn | 3,713 tons/km² |
Avdon, Northern District (Israel) CO2 Emissions
| 2013 CO2 emissions (tonnes/year) | 10,229 tn |
| 2013 CO2 emissions (tonnes/year) per capita | 10.1 tn |
| 2013 CO2 emissions intensity (tonnes/km²/year) | 8,773 tons/km² |
Natural Hazards Risk
Relative risk out of 10| Drought | High (9) |
| Flood | High (7) |
| Earthquake | High (7) |
* Risk, particularly concerning flood or landslide, may not be for the entire area.
Sources: 1. Dilley, M., R.S. Chen, U. Deichmann, A.L. Lerner-Lam, M. Arnold, J. Agwe, P. Buys, O. Kjekstad, B. Lyon, and G. Yetman. 2005. Natural Disaster Hotspots: A Global Risk Analysis. Washington, D.C.: World Bank. https://doi.org/10.1596/0-8213-5930-4.
2. Center for Hazards and Risk Research - CHRR - Columbia University, Center for International Earth Science Information Network - CIESIN - Columbia University, and International Research Institute for Climate and Society - IRI - Columbia University. 2005. Global Drought Hazard Frequency and Distribution. Palisades, NY: NASA Socioeconomic Data and Applications Center (SEDAC). https://doi.org/10.7927/H4VX0DFT.
3. Center for Hazards and Risk Research - CHRR - Columbia University, Center for International Earth Science Information Network - CIESIN - Columbia University. 2005. Global Earthquake Hazard Distribution - Peak Ground Acceleration. Palisades, NY: NASA Socioeconomic Data and Applications Center (SEDAC). https://doi.org/10.7927/H4BZ63ZS.
4. Center for Hazards and Risk Research - CHRR - Columbia University, Center for International Earth Science Information Network - CIESIN - Columbia University. 2005. Global Flood Hazard Frequency and Distribution. Palisades, NY: NASA Socioeconomic Data and Applications Center (SEDAC). https://doi.org/10.7927/H4668B3D.
Recent Nearby Earthquakes
Magnitude 3.0 and greater| Date | Time | Magnitude | Distance | Depth | Location | Link |
|---|---|---|---|---|---|---|
| 11/3/18 | 10:42 AM | 3.8 | 73.9 km | 32,140 m | 44km WNW of Sidon, Lebanon | usgs.gov |
| 7/4/18 | 12:45 PM | 4.7 | 37.2 km | 10,000 m | 5km SE of 'Eilabun, Israel | usgs.gov |
| 7/3/18 | 6:50 PM | 4 | 37.7 km | 10,000 m | 6km SSE of 'Eilabun, Israel | usgs.gov |
| 6/29/16 | 6:24 AM | 3.7 | 83.8 km | 13,850 m | 19km WSW of Beirut, Lebanon | usgs.gov |
| 7/5/14 | 2:41 PM | 4 | 63.1 km | 12,700 m | 3km NE of Sidon, Lebanon | usgs.gov |
| 10/20/13 | 5:54 AM | 3.5 | 42.3 km | 5,000 m | 8km NNE of Tiberias, Israel | usgs.gov |
| 8/7/11 | 1:52 AM | 4.1 | 85.3 km | 31,000 m | Dead Sea region | usgs.gov |
| 7/10/09 | 11:19 AM | 4 | 32.5 km | 10,000 m | Lebanon - Syria region | usgs.gov |
| 8/12/08 | 11:05 PM | 3.2 | 58.8 km | 10,000 m | eastern Mediterranean Sea | usgs.gov |
| 7/2/08 | 2:29 AM | 3.1 | 54.7 km | 20,100 m | Lebanon - Syria region | usgs.gov |
Find historical earthquake occurrences near Avdon, Northern District (Israel)
Earliest Date Latest Date
Magnitude 3.0 and greater Magnitude 4.0 and greater Magnitude 5.0 and greater

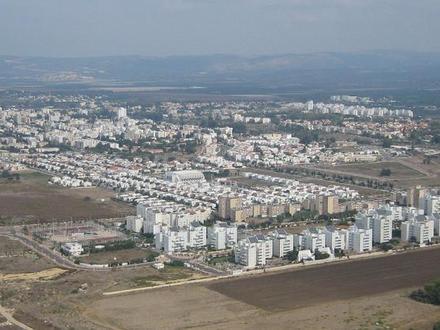
Avdon, Northern District (Israel)
Avdon (Hebrew: עַבְדּוֹן) is a moshav in northern Israel. Located near Shlomi, it falls under the jurisdiction of Ma'ale Yosef Regional Council. In 2014 it had a population of 577. Avdon Wikipedia Page
About Our Data
The data on this page is estimated using a number of publicly available tools and resources. It is provided without warranty, and could contain inaccuracies. Use at your own risk. See here for more information.