Businesses in Chhatarpur
Hotels & Travel
Restaurants
Automotive
Financial Services
Medical
Beauty & Spas
Community & Government
Industries
Business Distribution by Industry Shopping: 31.1%
Education: 8.8%
Food: 8%
Religion: 7%
Hotels & Travel: 6.2%
Industry: 5.5%
Other: 33.4%
| Industry Description | Number of Establishments | Average Google Rating | Businesses per 1,000 residents |
|---|---|---|---|
| Gas stations | 10 | 3.8 | 0.1 |
| Higher education (colleges and universities) | 35 | 3.6 | 0.2 |
| Banks | 20 | 3.7 | 0.1 |
| Loan companies | 28 | 3.7 | 0.1 |
| Grocery stores and supermarkets | 10 | 3.7 | 0.1 |
| Hotels and motels | 15 | 3.8 | 0.1 |
| Other accommodation | 22 | 3.8 | 0.1 |
| Wholesale of construction supplies | 10 | 4.1 | 0.1 |
| Hospitals | 14 | 4.1 | 0.1 |
| Hindu temples | 31 | 4.4 | 0.2 |
| Department stores | 11 | 3.6 | 0.1 |
| Electronics stores | 18 | 4.1 | 0.1 |
| Pharmacies and drug stores | 12 | 4.5 | 0.1 |
| Area of Chhatarpur, Madhya Pradesh | 50 km² |
| Population | 196,400 |
| Male Population | 103,892 (52.9%) |
| Female Population | 92,509 (47.1%) |
| Population change from 1975 to 2015 | +48.2% |
| Population change from 2000 to 2015 | +6.6% |
| Median Age | 21.7 |
| Male Median Age | 21.6 |
| Female Median Age | 21.8 |
| Area Codes | 5662, 7682 |
| Neighborhoods | Chetgiri Colony, Narayanpura, Choubey Colony, Hanuman Toria, Naya Mohalla, Police Lines, Shanti Nagar, Toria Mohalla, Vishwanath Colony |
| Local Time | Tuesday 1:20 AM |
| Timezone | India Standard Time |
| Lat & Lng | 24.9177° / 79.58871° |
| Pin Codes | 471001, 471105, 471202, 471301, 471315, More |
Chhatarpur, Madhya Pradesh - Map
Chhatarpur, Madhya Pradesh Population
Years 1975 to 2015| Data | 1975 | 1990 | 2000 | 2015 |
|---|---|---|---|---|
| Population | 132,528 | 187,516 | 184,155 | 196,400 |
| Population Density | 2,650 / km² | 3,750 / km² | 3,683 / km² | 3,928 / km² |
Chhatarpur Population change from 2000 to 2015
Increase of 6.6% from year 2000 to 2015| Location | Change since 1975 | Change since 1990 | Change since 2000 |
|---|---|---|---|
| Chhatarpur, Madhya Pradesh | +48.2% | +4.7% | +6.6% |
| Madhya Pradesh | +134% | +59.7% | +28.6% |
| India | +111.1% | +50.6% | +24.5% |
Chhatarpur, Madhya Pradesh Median Age
Median Age: 21.7 years| Location | Median Age | Median Age (Female) | Median Age (Male) |
|---|---|---|---|
| Chhatarpur, Madhya Pradesh | 21.7 years | 21.8 years | 21.6 years |
| Madhya Pradesh | 23.4 years | 23.7 years | 23.1 years |
| India | 24.9 years | 25.4 years | 24.5 years |
Chhatarpur, Madhya Pradesh Population Tree
Population By Age and Gender| Age | Male | Female | Total |
|---|---|---|---|
| Under 5 | 11,228 | 10,287 | 21,515 |
| 5-9 | 12,874 | 11,750 | 24,625 |
| 10-14 | 13,400 | 12,146 | 25,547 |
| 15-19 | 11,376 | 9,287 | 20,664 |
| 20-24 | 9,531 | 7,841 | 17,373 |
| 25-29 | 7,691 | 6,807 | 14,499 |
| 30-34 | 6,687 | 6,382 | 13,069 |
| 35-39 | 6,353 | 5,740 | 12,093 |
| 40-44 | 5,452 | 4,859 | 10,312 |
| 45-49 | 4,540 | 3,985 | 8,525 |
| 50-54 | 3,609 | 3,046 | 6,655 |
| 55-59 | 2,729 | 2,618 | 5,347 |
| 60-64 | 2,838 | 2,563 | 5,402 |
| 65-69 | 2,042 | 2,060 | 4,103 |
| 70-74 | 1,776 | 1,498 | 3,275 |
| 75-79 | 781 | 754 | 1,535 |
| 80-84 | 581 | 508 | 1,089 |
| 85 Plus | 403 | 378 | 781 |
Chhatarpur, Madhya Pradesh Population Density
Population Density: 3,928 / km²| Location | Population | Area | Population Density |
|---|---|---|---|
| Chhatarpur, Madhya Pradesh | 196,400 | 50 km² | 3,928 / km² |
| Madhya Pradesh | 79.1 million | 308,149.6 km² | 256.8 / km² |
| India | 1.3 billion | 3,083,563.4 km² | 423.8 / km² |
Chhatarpur, Madhya Pradesh Historical and Projected Population
Estimated Ancient Population until 2100Sources:
1. JRC (European Commission's Joint Research Centre) work on the GHS built-up grid
2. CIESIN (Center for International Earth Science Information Network)
3. [Link] Klein Goldewijk, K., Beusen, A., Doelman, J., and Stehfest, E.: Anthropogenic land use estimates for the Holocene – HYDE 3.2, Earth Syst. Sci. Data, 9, 927–953, https://doi.org/10.5194/essd-9-927-2017, 2017.
Neighborhoods
Business Distribution by neighborhood in Chhatarpur Naya Mohalla: 22%
Shanti Nagar: 11.8%
Chetgiri Colony, Narayanpura: 8.3%
Choubey Colony: 7.3%
Toria Mohalla: 6%
Vishwanath Colony: 6%
Other: 38.7%
Area Codes
Percentage Area Codes used by businesses in Chhatarpur Area Code 7682: 54.9%
Area Code 180: 6.9%
Other: 38.3%
Human Development Index (HDI)
Statistic composite index of life expectancy, education, and per capita income.Sources: [Link] Kummu, M., Taka, M. & Guillaume, J. Gridded global datasets for Gross Domestic Product and Human Development Index over 1990–2015. Sci Data 5, 180004 (2018) doi:10.1038/sdata.2018.4
Chhatarpur, Madhya Pradesh CO2 Emissions
Carbon Dioxide (CO2) Emissions Per Capita in Tonnes Per Year| Location | CO2 Emissions | CO2 Emissions Per Capita | CO2 Emissions Intensity |
|---|---|---|---|
| Chhatarpur, Madhya Pradesh | 261,376 tn | 1.33 tn | 5,227 tons/km² |
| Madhya Pradesh | 98,758,435 tn | 1.25 tn | 320.5 tons/km² |
| India | 1,928,568,344 tn | 1.48 tn | 625.4 tons/km² |
Chhatarpur, Madhya Pradesh CO2 Emissions
| 2013 CO2 emissions (tonnes/year) | 261,376 tn |
| 2013 CO2 emissions (tonnes/year) per capita | 1.33 tn |
| 2013 CO2 emissions intensity (tonnes/km²/year) | 5,227 tons/km² |
Natural Hazards Risk
Relative risk out of 10| Drought | High (8) |
* Risk, particularly concerning flood or landslide, may not be for the entire area.
Sources: 1. Dilley, M., R.S. Chen, U. Deichmann, A.L. Lerner-Lam, M. Arnold, J. Agwe, P. Buys, O. Kjekstad, B. Lyon, and G. Yetman. 2005. Natural Disaster Hotspots: A Global Risk Analysis. Washington, D.C.: World Bank. https://doi.org/10.1596/0-8213-5930-4.
2. Center for Hazards and Risk Research - CHRR - Columbia University, Center for International Earth Science Information Network - CIESIN - Columbia University, and International Research Institute for Climate and Society - IRI - Columbia University. 2005. Global Drought Hazard Frequency and Distribution. Palisades, NY: NASA Socioeconomic Data and Applications Center (SEDAC). https://doi.org/10.7927/H4VX0DFT.

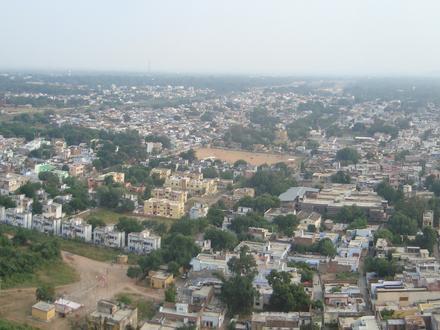
Chhatarpur, Madhya Pradesh
Chhatarpur is a city and a municipality in Chhatarpur district in the state of Madhya Pradesh, India. It is the administrative headquarters of Chhatarpur District. Chhatarpur Wikipedia Page
Pin Codes
Percentage of businesses by Pin Codes in Chhatarpur Pin Code 471001: 72.7%
Pin Code 822113: 6.1%
Other: 21.3%

About Our Data
The data on this page is estimated using a number of publicly available tools and resources. It is provided without warranty, and could contain inaccuracies. Use at your own risk. See here for more information.