Businesses in Nandikotkur
Hotels & Travel
Restaurants
Automotive
Financial Services
Medical
Beauty & Spas
Community & Government
Industries
Business Distribution by Industry Shopping: 25.3%
Food: 9.1%
Education: 8.4%
Industry: 7%
Religion: 7%
Hotels & Travel: 6.5%
Restaurants: 5.1%
Other: 31.6%
| Area of Nandikotkur, Andhra Pradesh | 23.1 km² |
| Population | 91,162 |
| Male Population | 45,648 (50.1%) |
| Female Population | 45,514 (49.9%) |
| Population change from 1975 to 2015 | +100.9% |
| Population change from 2000 to 2015 | +21.2% |
| Median Age | 25.2 |
| Male Median Age | 24.6 |
| Female Median Age | 25.8 |
| Area Codes | 8513 |
| Local Time | Friday 9:12 PM |
| Timezone | India Standard Time |
| Lat & Lng | 15.85668° / 78.26569° |
Nandikotkur, Andhra Pradesh - Map
Nandikotkur, Andhra Pradesh Population
Years 1975 to 2015| Data | 1975 | 1990 | 2000 | 2015 |
|---|---|---|---|---|
| Population | 45,375 | 62,642 | 75,247 | 91,162 |
| Population Density | 1,960 / km² | 2,707 / km² | 3,251 / km² | 3,939 / km² |
Nandikotkur Population change from 2000 to 2015
Increase of 21.2% from year 2000 to 2015| Location | Change since 1975 | Change since 1990 | Change since 2000 |
|---|---|---|---|
| Nandikotkur, Andhra Pradesh | +100.9% | +45.5% | +21.2% |
| Andhra Pradesh | +60.1% | +25.6% | +11.4% |
| India | +111.1% | +50.6% | +24.5% |
Nandikotkur, Andhra Pradesh Median Age
Median Age: 25.2 years| Location | Median Age | Median Age (Female) | Median Age (Male) |
|---|---|---|---|
| Nandikotkur, Andhra Pradesh | 25.2 years | 25.8 years | 24.6 years |
| Andhra Pradesh | 28 years | 28.5 years | 27.6 years |
| India | 24.9 years | 25.4 years | 24.5 years |
Nandikotkur, Andhra Pradesh Population Tree
Population By Age and Gender| Age | Male | Female | Total |
|---|---|---|---|
| Under 5 | 4,007 | 3,829 | 7,837 |
| 5-9 | 4,752 | 4,516 | 9,268 |
| 10-14 | 5,128 | 4,879 | 10,008 |
| 15-19 | 4,816 | 4,379 | 9,195 |
| 20-24 | 4,463 | 4,444 | 8,907 |
| 25-29 | 4,030 | 4,311 | 8,341 |
| 30-34 | 3,481 | 3,471 | 6,952 |
| 35-39 | 3,349 | 3,423 | 6,772 |
| 40-44 | 2,856 | 2,599 | 5,456 |
| 45-49 | 2,339 | 2,277 | 4,617 |
| 50-54 | 1,827 | 1,770 | 3,597 |
| 55-59 | 1,282 | 1,519 | 2,802 |
| 60-64 | 1,362 | 1,638 | 3,001 |
| 65-69 | 862 | 1,040 | 1,903 |
| 70-74 | 613 | 722 | 1,335 |
| 75-79 | 232 | 294 | 526 |
| 80-84 | 146 | 240 | 387 |
| 85 Plus | 102 | 162 | 265 |
Nandikotkur, Andhra Pradesh Population Density
Population Density: 3,939 / km²| Location | Population | Area | Population Density |
|---|---|---|---|
| Nandikotkur, Andhra Pradesh | 91,162 | 23.1 km² | 3,939 / km² |
| Andhra Pradesh | 52.0 million | 160,197.6 km² | 324.6 / km² |
| India | 1.3 billion | 3,083,563.4 km² | 423.8 / km² |
Nandikotkur, Andhra Pradesh Historical and Projected Population
Estimated Ancient Population until 2100Sources:
1. JRC (European Commission's Joint Research Centre) work on the GHS built-up grid
2. CIESIN (Center for International Earth Science Information Network)
3. [Link] Klein Goldewijk, K., Beusen, A., Doelman, J., and Stehfest, E.: Anthropogenic land use estimates for the Holocene – HYDE 3.2, Earth Syst. Sci. Data, 9, 927–953, https://doi.org/10.5194/essd-9-927-2017, 2017.
Neighborhoods
Business Distribution by neighborhood in Nandikotkur Maruthi Nagar: 50%
BBR Nagar: 25%
Saibaba Pet: 25%
Human Development Index (HDI)
Statistic composite index of life expectancy, education, and per capita income.Sources: [Link] Kummu, M., Taka, M. & Guillaume, J. Gridded global datasets for Gross Domestic Product and Human Development Index over 1990–2015. Sci Data 5, 180004 (2018) doi:10.1038/sdata.2018.4
Nandikotkur, Andhra Pradesh CO2 Emissions
Carbon Dioxide (CO2) Emissions Per Capita in Tonnes Per Year| Location | CO2 Emissions | CO2 Emissions Per Capita | CO2 Emissions Intensity |
|---|---|---|---|
| Nandikotkur, Andhra Pradesh | 131,223 tn | 1.44 tn | 5,670 tons/km² |
| Andhra Pradesh | 85,497,652 tn | 1.64 tn | 533.7 tons/km² |
| India | 1,928,568,344 tn | 1.48 tn | 625.4 tons/km² |
Nandikotkur, Andhra Pradesh CO2 Emissions
| 2013 CO2 emissions (tonnes/year) | 131,223 tn |
| 2013 CO2 emissions (tonnes/year) per capita | 1.44 tn |
| 2013 CO2 emissions intensity (tonnes/km²/year) | 5,670 tons/km² |
Natural Hazards Risk
Relative risk out of 10| Drought | Medium (5) |
| Flood | High (7) |
* Risk, particularly concerning flood or landslide, may not be for the entire area.
Sources: 1. Dilley, M., R.S. Chen, U. Deichmann, A.L. Lerner-Lam, M. Arnold, J. Agwe, P. Buys, O. Kjekstad, B. Lyon, and G. Yetman. 2005. Natural Disaster Hotspots: A Global Risk Analysis. Washington, D.C.: World Bank. https://doi.org/10.1596/0-8213-5930-4.
2. Center for Hazards and Risk Research - CHRR - Columbia University, Center for International Earth Science Information Network - CIESIN - Columbia University. 2005. Global Flood Hazard Frequency and Distribution. Palisades, NY: NASA Socioeconomic Data and Applications Center (SEDAC). https://doi.org/10.7927/H4668B3D.
3. Center for Hazards and Risk Research - CHRR - Columbia University, Center for International Earth Science Information Network - CIESIN - Columbia University, and International Research Institute for Climate and Society - IRI - Columbia University. 2005. Global Drought Hazard Frequency and Distribution. Palisades, NY: NASA Socioeconomic Data and Applications Center (SEDAC). https://doi.org/10.7927/H4VX0DFT.
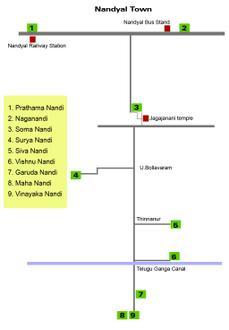
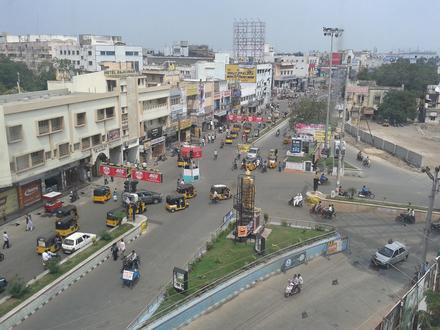
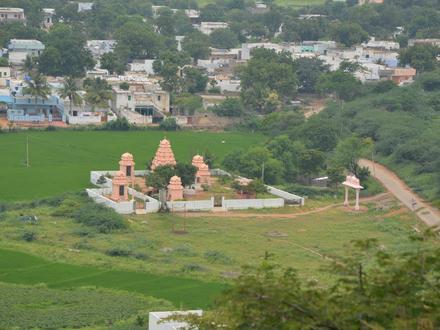
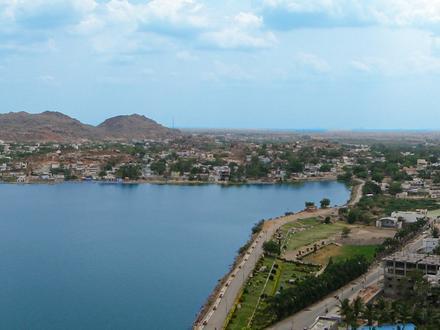
Nandikotkur, Andhra Pradesh
Nandikotkur is a town and mandal in Kurnool district of Andhra Pradesh, India. Nandikotkur Wikipedia Page
About Our Data
The data on this page is estimated using a number of publicly available tools and resources. It is provided without warranty, and could contain inaccuracies. Use at your own risk. See here for more information.