Businesses in Vibo Valentia
Hotels & Travel
Restaurants
Automotive
Financial Services
Medical
Beauty & Spas
Community & Government
Industries
Business Distribution by Industry Shopping: 24.4%
Professional Services: 13.4%
Industry: 7.2%
Restaurants: 7.1%
Food: 6.6%
Hotels & Travel: 5.9%
Medical: 5.2%
Other: 30.2%
| Industry Description | Number of Establishments | Average Google Rating | Businesses per 1,000 residents |
|---|---|---|---|
| Car parts | 18 | 4.4 | 1.1 |
| Car repair | 33 | 4.5 | 2.0 |
| Beauty salons | 26 | 4.6 | 1.6 |
| Hairdressers | 22 | 4.5 | 1.3 |
| Public administration | 21 | 4.1 | 1.3 |
| Trade unions | 46 | 4.4 | 2.8 |
| Banks | 19 | 2.5 | 1.2 |
| Loan companies | 49 | 2.9 | 3.0 |
| Grocery stores and supermarkets | 39 | 4.2 | 2.4 |
| General contractors | 19 | 4.4 | 1.2 |
| Real estate | 21 | 4.1 | 1.3 |
| Hotels and motels | 20 | 4.5 | 1.2 |
| Other accommodation | 28 | 4.5 | 1.7 |
| Construction of buildings | 19 | 4.0 | 1.2 |
| Wholesale of machinery | 23 | 4.4 | 1.4 |
| Dentists | 32 | 5.0 | 1.9 |
| General practitioners | 21 | 4.7 | 1.3 |
| Health and medical | 59 | 4.7 | 3.6 |
| Accountants | 20 | 5.0 | 1.2 |
| Lawyers legal | 91 | 4.6 | 5.5 |
| Technical construction services | 25 | 4.2 | 1.5 |
| Bars, pubs and taverns | 37 | 4.4 | 2.2 |
| Pizza | 18 | 4.3 | 1.1 |
| Clothing stores | 78 | 4.3 | 4.7 |
| Electronics stores | 32 | 4.2 | 1.9 |
| Furniture stores | 28 | 4.4 | 1.7 |
| Household appliances and goods | 28 | 4.4 | 1.7 |
| Jewelers and watches | 25 | 4.6 | 1.5 |
| Pharmacies and drug stores | 18 | 4.1 | 1.1 |
| Women's clothing | 18 | 3.8 | 1.1 |
| Area of Vibo Valentia, Calabria | 46.2 km² |
| Population | 16,507 |
| Male Population | 7,980 (48.3%) |
| Female Population | 8,527 (51.7%) |
| Population change from 1975 to 2015 | -12.3% |
| Population change from 2000 to 2015 | -4.5% |
| Median Age | 40.3 |
| Male Median Age | 39.2 |
| Female Median Age | 41.3 |
| Area Codes | 963 |
| Local Time | Monday 11:30 AM |
| Timezone | Central European Summer Time |
| Lat & Lng | 38.67618° / 16.10094° |
| Postal Codes | 89813, 89814, 89816, 89817, 89844, More |
Vibo Valentia, Calabria - Map
Vibo Valentia, Calabria Population
Years 1975 to 2015| Data | 1975 | 1990 | 2000 | 2015 |
|---|---|---|---|---|
| Population | 18,819 | 18,167 | 17,287 | 16,507 |
| Population Density | 407.3 / km² | 393.2 / km² | 374.2 / km² | 357.3 / km² |
Vibo Valentia Population change from 2000 to 2015
Decrease of 4.5% from year 2000 to 2015| Location | Change since 1975 | Change since 1990 | Change since 2000 |
|---|---|---|---|
| Vibo Valentia, Calabria | -12.3% | -9.1% | -4.5% |
| Vibo Valentia Region | -24.1% | -15.5% | -8% |
| Italy | +8.3% | +4.9% | +4.7% |
Vibo Valentia, Calabria Median Age
Median Age: 40.3 years| Location | Median Age | Median Age (Female) | Median Age (Male) |
|---|---|---|---|
| Vibo Valentia, Calabria | 40.3 years | 41.3 years | 39.2 years |
| Vibo Valentia Region | 38.3 years | 38.8 years | 37.8 years |
| Italy | 40.9 years | 41.5 years | 40.3 years |
Vibo Valentia, Calabria Population Tree
Population By Age and Gender| Age | Male | Female | Total |
|---|---|---|---|
| Under 5 | 388 | 385 | 774 |
| 5-9 | 419 | 435 | 854 |
| 10-14 | 427 | 433 | 860 |
| 15-19 | 538 | 486 | 1,025 |
| 20-24 | 549 | 548 | 1,098 |
| 25-29 | 537 | 547 | 1,084 |
| 30-34 | 593 | 603 | 1,197 |
| 35-39 | 643 | 650 | 1,294 |
| 40-44 | 610 | 687 | 1,298 |
| 45-49 | 615 | 785 | 1,400 |
| 50-54 | 631 | 666 | 1,298 |
| 55-59 | 575 | 710 | 1,286 |
| 60-64 | 615 | 673 | 1,288 |
| 65-69 | 443 | 450 | 893 |
| 70-74 | 397 | 468 | 865 |
| 75-79 | 0 | 0 | 0 |
| 80-84 | 0 | 0 | 0 |
| 85 Plus | 0 | 0 | 0 |
Vibo Valentia, Calabria Population Density
Population Density: 357.3 / km²| Location | Population | Area | Population Density |
|---|---|---|---|
| Vibo Valentia, Calabria | 16,507 | 46.2 km² | 357.3 / km² |
| Vibo Valentia Region | 158,684 | 1,140.6 km² | 139.1 / km² |
| Italy | 59.3 million | 301,510.7 km² | 196.7 / km² |
Area Codes
Percentage Area Codes used by businesses in Vibo Valentia Area Code 33: 26.9%
Area Code 34: 24.6%
Area Code 32: 19.9%
Area Code 38: 9.9%
Area Code 39: 7.6%
Area Code 80: 7%
Other: 4.1%
Business distribution by price for Vibo Valentia, Calabria
Moderate: 38.5%
Inexpensive: 35.4%
Expensive: 26.2%
Human Development Index (HDI)
Statistic composite index of life expectancy, education, and per capita income.Sources: [Link] Kummu, M., Taka, M. & Guillaume, J. Gridded global datasets for Gross Domestic Product and Human Development Index over 1990–2015. Sci Data 5, 180004 (2018) doi:10.1038/sdata.2018.4
Vibo Valentia, Calabria CO2 Emissions
Carbon Dioxide (CO2) Emissions Per Capita in Tonnes Per Year| Location | CO2 Emissions | CO2 Emissions Per Capita | CO2 Emissions Intensity |
|---|---|---|---|
| Vibo Valentia, Calabria | 87,572 tn | 5.31 tn | 1,895 tons/km² |
| Vibo Valentia Region | 840,546 tn | 5.3 tn | 736.9 tons/km² |
| Italy | 399,008,504 tn | 6.73 tn | 1,323 tons/km² |
Vibo Valentia, Calabria CO2 Emissions
| 2013 CO2 emissions (tonnes/year) | 87,572 tn |
| 2013 CO2 emissions (tonnes/year) per capita | 5.31 tn |
| 2013 CO2 emissions intensity (tonnes/km²/year) | 1,895 tons/km² |
Natural Hazards Risk
Relative risk out of 10| Earthquake | High (7) |
* Risk, particularly concerning flood or landslide, may not be for the entire area.
Sources: 1. Dilley, M., R.S. Chen, U. Deichmann, A.L. Lerner-Lam, M. Arnold, J. Agwe, P. Buys, O. Kjekstad, B. Lyon, and G. Yetman. 2005. Natural Disaster Hotspots: A Global Risk Analysis. Washington, D.C.: World Bank. https://doi.org/10.1596/0-8213-5930-4.
2. Center for Hazards and Risk Research - CHRR - Columbia University, Center for International Earth Science Information Network - CIESIN - Columbia University. 2005. Global Earthquake Hazard Distribution - Peak Ground Acceleration. Palisades, NY: NASA Socioeconomic Data and Applications Center (SEDAC). https://doi.org/10.7927/H4BZ63ZS.
Recent Nearby Earthquakes
Magnitude 3.0 and greater| Date | Time | Magnitude | Distance | Depth | Location | Link |
|---|---|---|---|---|---|---|
| 5/26/19 | 4:31 PM | 4.1 | 16.2 km | 6,510 m | 1km S of Melicucca, Italy | usgs.gov |
| 9/27/18 | 10:24 PM | 4.4 | 41.1 km | 10,000 m | 14km NW of Palmi, Italy | usgs.gov |
| 7/13/18 | 7:50 PM | 4.5 | 11.6 km | 65,519 m | 2km NNW of Zungri, Italy | usgs.gov |
| 8/3/14 | 10:54 PM | 4.3 | 35.8 km | 171,000 m | 18km WNW of Tropea, Italy | usgs.gov |
| 5/9/13 | 1:41 PM | 3.4 | 58.1 km | 10,300 m | 1km NE of Amantea, Italy | usgs.gov |
| 11/12/12 | 11:06 PM | 4.3 | 50.9 km | 75,700 m | Sicily, Italy | usgs.gov |
| 7/10/08 | 5:50 AM | 3.5 | 34 km | 8,800 m | southern Italy | usgs.gov |
| 7/9/08 | 4:08 PM | 3.2 | 34.1 km | 8,800 m | southern Italy | usgs.gov |
| 4/5/08 | 12:10 PM | 3.1 | 41.4 km | 98,800 m | Sicily, Italy | usgs.gov |
| 2/15/08 | 12:21 PM | 3.1 | 41.7 km | 180,600 m | Sicily, Italy | usgs.gov |
Find historical earthquake occurrences near Vibo Valentia, Calabria
Earliest Date Latest Date
Magnitude 3.0 and greater Magnitude 4.0 and greater Magnitude 5.0 and greater

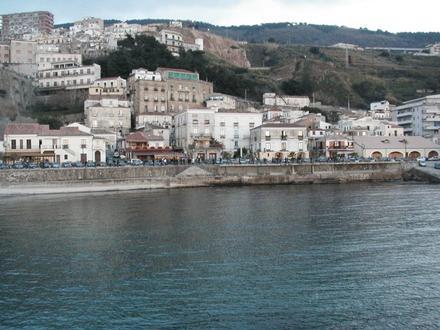
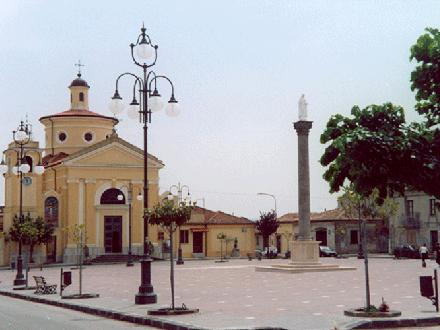
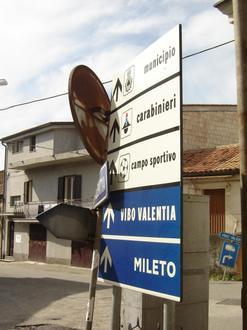
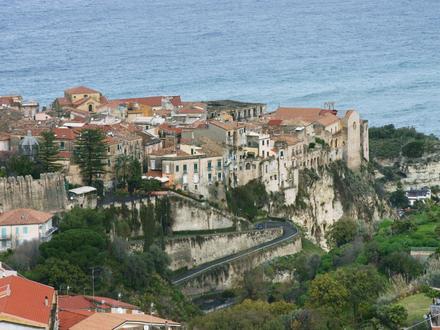
Vibo Valentia, Calabria
Vibo Valentia (Italian: [ˈviːbo vaˈlɛntsja]) is a city and comune (municipality) in the Calabria region of southern Italy, near the Tyrrhenian Sea. It is the capital of the province of Vibo Valentia, and is an agricultural, commercial and tourist cen.. Vibo Valentia Wikipedia Page
About Our Data
The data on this page is estimated using a number of publicly available tools and resources. It is provided without warranty, and could contain inaccuracies. Use at your own risk. See here for more information.