- World
- »
- JP
- »
- Nara Prefecture
- »
- Sakurai, Nara
Businesses in Sakurai, Nara
Hotels & Travel
Restaurants
Automotive
Financial Services
Medical
Beauty & Spas
Community & Government
Industries
Business Distribution by Industry Shopping: 18.8%
Industry: 10.8%
Restaurants: 10.6%
Religion: 8.3%
Food: 8.3%
Medical: 5.4%
Home Services: 5.3%
Automotive: 5.2%
Other: 27.3%
| Industry Description | Number of Establishments | Average Google Rating | Businesses per 1,000 residents |
|---|---|---|---|
| Car repair | 38 | 4.4 | 5.9 |
| Beauty salons | 65 | 3.9 | 10.1 |
| Hairdressers | 74 | 3.8 | 11.5 |
| Public administration | 52 | 3.2 | 8.1 |
| Museums | 101 | 4.3 | 15.6 |
| Loan companies | 34 | 3.0 | 5.3 |
| Convenience stores | 27 | 3.3 | 4.2 |
| Grocery stores and supermarkets | 99 | 3.6 | 15.3 |
| General contractors | 38 | 4.1 | 5.9 |
| Travel agencies | 27 | 3.6 | 4.2 |
| Construction of buildings | 31 | 3.7 | 4.8 |
| Wholesale of construction supplies | 59 | 3.8 | 9.1 |
| Dentists | 32 | 3.8 | 5.0 |
| Health and medical | 77 | 4.0 | 11.9 |
| Hospitals | 32 | 3.5 | 5.0 |
| Buddhist temples | 36 | 4.3 | 5.6 |
| Cafes | 29 | 3.9 | 4.5 |
| Japanese restaurants | 53 | 3.8 | 8.2 |
| Household appliances and goods | 27 | 4.3 | 4.2 |
| Pharmacies and drug stores | 41 | 3.7 | 6.3 |
| Shopping other | 31 | 3.6 | 4.8 |
| Area of Sakurai, Nara | 98.9 km² |
| Population | 6,457 |
| Male Population | 3,050 (47.2%) |
| Female Population | 3,407 (52.8%) |
| Population change from 1975 to 2015 | -2.8% |
| Population change from 2000 to 2015 | -4.5% |
| Median Age | 46.7 |
| Male Median Age | 45 |
| Female Median Age | 48.2 |
| Area Codes | 744 |
| Neighborhoods | Hase, Kaminosho, Kibi, Miwa, Odono, Sakurai, Shiba, Tobi |
| Local Time | Friday 9:59 AM |
| Timezone | Japan Standard Time |
| Lat & Lng | 34.5° / 135.85° |
| Postal Codes | 633 |
Sakurai, Nara - Map
Sakurai, Nara Population
Years 1975 to 2015| Data | 1975 | 1990 | 2000 | 2015 |
|---|---|---|---|---|
| Population | 6,645 | 6,927 | 6,762 | 6,457 |
| Population Density | 67.2 / km² | 70.0 / km² | 68.4 / km² | 65.3 / km² |
Sakurai, Nara Population change from 2000 to 2015
Decrease of 4.5% from year 2000 to 2015| Location | Change since 1975 | Change since 1990 | Change since 2000 |
|---|---|---|---|
| Sakurai, Nara | -2.8% | -6.8% | -4.5% |
| Nara Prefecture | +1.4% | -4.3% | -4.2% |
| Japan | +13.6% | +3.4% | +0.6% |
Sakurai, Nara Median Age
Median Age: 46.7 years| Location | Median Age | Median Age (Female) | Median Age (Male) |
|---|---|---|---|
| Sakurai, Nara | 46.7 years | 48.2 years | 45 years |
| Nara Prefecture | 46.2 years | 47.6 years | 44.7 years |
| Japan | 45.2 years | 46.9 years | 43.5 years |
Sakurai, Nara Population Tree
Population By Age and Gender| Age | Male | Female | Total |
|---|---|---|---|
| Under 5 | 124 | 130 | 254 |
| 5-9 | 149 | 123 | 273 |
| 10-14 | 166 | 154 | 320 |
| 15-19 | 171 | 168 | 339 |
| 20-24 | 158 | 165 | 324 |
| 25-29 | 164 | 179 | 344 |
| 30-34 | 187 | 198 | 385 |
| 35-39 | 213 | 229 | 443 |
| 40-44 | 196 | 220 | 416 |
| 45-49 | 190 | 214 | 404 |
| 50-54 | 189 | 212 | 401 |
| 55-59 | 220 | 232 | 453 |
| 60-64 | 253 | 278 | 531 |
| 65-69 | 204 | 227 | 432 |
| 70-74 | 173 | 198 | 372 |
| 75-79 | 137 | 180 | 317 |
| 80-84 | 99 | 144 | 243 |
| 85 Plus | 59 | 157 | 216 |
Sakurai, Nara Population Density
Population Density: 65.3 / km²| Location | Population | Area | Population Density |
|---|---|---|---|
| Sakurai, Nara | 6,457 | 98.9 km² | 65.3 / km² |
| Nara Prefecture | 1.4 million | 3,691.5 km² | 368.7 / km² |
| Japan | 122.9 million | 373,410.9 km² | 329.2 / km² |
Sakurai, Nara Historical Population
Estimated Population from 500 to 2015Sources:
1. JRC (European Commission's Joint Research Centre) work on the GHS built-up grid
2. CIESIN (Center for International Earth Science Information Network)
3. [Link] Klein Goldewijk, K., Beusen, A., Doelman, J., and Stehfest, E.: Anthropogenic land use estimates for the Holocene – HYDE 3.2, Earth Syst. Sci. Data, 9, 927–953, https://doi.org/10.5194/essd-9-927-2017, 2017.
Neighborhoods
Business Distribution by neighborhood in Sakurai, Nara Sakurai: 11.4%
Odono: 9.6%
Miwa: 9.3%
Hase: 5%
Other: 64.6%
Business distribution by price for Sakurai, Nara
Moderate: 52.1%
Inexpensive: 45.9%
Expensive: 1.4%
Very Expensive: 0.7%
Human Development Index (HDI)
Statistic composite index of life expectancy, education, and per capita income.Sources: [Link] Kummu, M., Taka, M. & Guillaume, J. Gridded global datasets for Gross Domestic Product and Human Development Index over 1990–2015. Sci Data 5, 180004 (2018) doi:10.1038/sdata.2018.4
Sakurai, Nara CO2 Emissions
Carbon Dioxide (CO2) Emissions Per Capita in Tonnes Per Year| Location | CO2 Emissions | CO2 Emissions Per Capita | CO2 Emissions Intensity |
|---|---|---|---|
| Sakurai, Nara | 60,926 tn | 9.44 tn | 615.9 tons/km² |
| Nara Prefecture | 12,606,222 tn | 9.26 tn | 3,414 tons/km² |
| Japan | 541,995,101 tn | 4.41 tn | 1,451 tons/km² |
Sakurai, Nara CO2 Emissions
| 2013 CO2 emissions (tonnes/year) | 60,926 tn |
| 2013 CO2 emissions (tonnes/year) per capita | 9.44 tn |
| 2013 CO2 emissions intensity (tonnes/km²/year) | 615.9 tons/km² |
Natural Hazards Risk
Relative risk out of 10| Cyclone | High (10) |
| Flood | High (7) |
| Earthquake | High (8) |
* Risk, particularly concerning flood or landslide, may not be for the entire area.
Sources: 1. Dilley, M., R.S. Chen, U. Deichmann, A.L. Lerner-Lam, M. Arnold, J. Agwe, P. Buys, O. Kjekstad, B. Lyon, and G. Yetman. 2005. Natural Disaster Hotspots: A Global Risk Analysis. Washington, D.C.: World Bank. https://doi.org/10.1596/0-8213-5930-4.
2. Center for Hazards and Risk Research - CHRR - Columbia University, Center for International Earth Science Information Network - CIESIN - Columbia University. 2005. Global Earthquake Hazard Distribution - Peak Ground Acceleration. Palisades, NY: NASA Socioeconomic Data and Applications Center (SEDAC). https://doi.org/10.7927/H4BZ63ZS.
3. Center for Hazards and Risk Research - CHRR - Columbia University, Center for International Earth Science Information Network - CIESIN - Columbia University. 2005. Global Flood Hazard Frequency and Distribution. Palisades, NY: NASA Socioeconomic Data and Applications Center (SEDAC). https://doi.org/10.7927/H4668B3D.
4. Center for Hazards and Risk Research - CHRR - Columbia University, Center for International Earth Science Information Network - CIESIN - Columbia University, International Bank for Reconstruction and Development - The World Bank, and United Nations Environment Programme Global Resource Information Database Geneva - UNEP/GRID-Geneva. 2005. Global Cyclone Hazard Frequency and Distribution. Palisades, NY: NASA Socioeconomic Data and Applications Center (SEDAC). https://doi.org/10.7927/H4CZ353K.
Recent Nearby Earthquakes
Magnitude 3.0 and greater| Date | Time | Magnitude | Distance | Depth | Location | Link |
|---|---|---|---|---|---|---|
| 10/27/18 | 4:51 AM | 4.4 | 12.7 km | 68,080 m | 1km SSW of Yoshino-cho, Japan | usgs.gov |
| 6/23/18 | 7:08 AM | 3.9 | 39.9 km | 10,000 m | 2km NE of Hirakata, Japan | usgs.gov |
| 6/18/18 | 3:52 PM | 3.7 | 35.3 km | 10,000 m | 1km ENE of Neyagawa, Japan | usgs.gov |
| 6/18/18 | 8:31 AM | 4.6 | 38.8 km | 10,000 m | 2km NNW of Neyagawa, Japan | usgs.gov |
| 6/17/18 | 3:58 PM | 5.5 | 40.9 km | 10,340 m | 1km NW of Hirakata, Japan | usgs.gov |
| 3/25/16 | 3:20 AM | 4.2 | 11.9 km | 375,700 m | 9km S of Haibara, Japan | usgs.gov |
| 11/11/14 | 5:13 PM | 4.6 | 35.3 km | 62,380 m | 5km NNW of Koya, Japan | usgs.gov |
| 7/19/14 | 10:35 PM | 4 | 36.5 km | 373,250 m | 3km ESE of Hirakata, Japan | usgs.gov |
| 12/14/13 | 7:13 AM | 4.5 | 10.4 km | 21,810 m | 2km ENE of Tenri, Japan | usgs.gov |
| 11/4/13 | 7:40 PM | 4.2 | 35 km | 348,730 m | 7km SSE of Ueno, Japan | usgs.gov |
Find historical earthquake occurrences near Sakurai, Nara
Earliest Date Latest Date
Magnitude 3.0 and greater Magnitude 4.0 and greater Magnitude 5.0 and greater

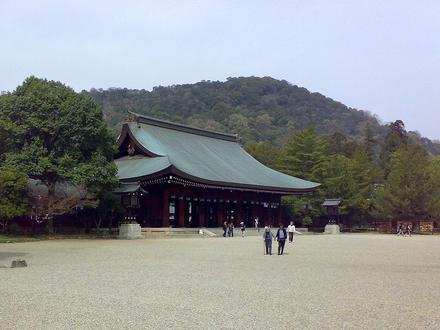
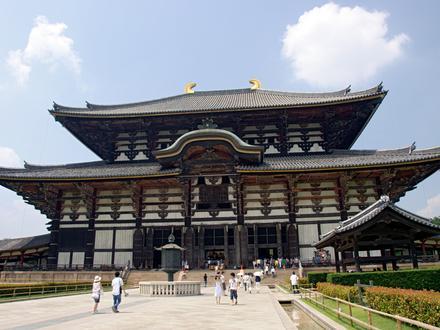
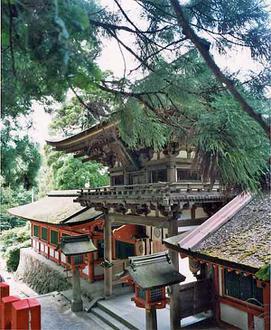
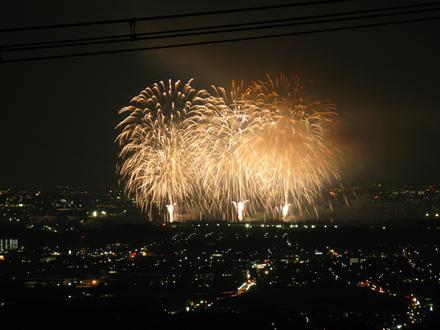
Sakurai, Nara
Sakurai (桜井市, Sakurai-shi) is a city located in Nara Prefecture, Japan. of April 1, 2015, the city has an estimated population of 58,436, and 24,389 households. The population density is 613.68 persons per km², and the total area is 98.92 km². Sakurai, Nara Wikipedia Page
About Our Data
The data on this page is estimated using a number of publicly available tools and resources. It is provided without warranty, and could contain inaccuracies. Use at your own risk. See here for more information.