- World
- »
- JP
- »
- Mie Prefecture
- »
- Tsu, Mie
Businesses in Tsu, Mie
Hotels & Travel
Restaurants
Automotive
Financial Services
Medical
Beauty & Spas
Community & Government
Industries
Business Distribution by Industry Shopping: 16.2%
Industry: 11.6%
Restaurants: 11.3%
Home Services: 7.7%
Food: 6.5%
Professional Services: 6%
Medical: 5.8%
Other: 35%
| Industry Description | Number of Establishments | Average Google Rating | Businesses per 1,000 residents |
|---|---|---|---|
| Car parts | 152 | 3.7 | 0.8 |
| Gas stations | 168 | 3.6 | 0.9 |
| Beauty salons | 387 | 3.9 | 2.1 |
| Hairdressers | 431 | 4.0 | 2.4 |
| Public administration | 599 | 3.4 | 3.3 |
| Loan companies | 230 | 3.2 | 1.3 |
| Convenience stores | 176 | 3.2 | 1.0 |
| Grocery stores and supermarkets | 393 | 3.6 | 2.2 |
| General contractors | 255 | 3.3 | 1.4 |
| Real estate | 197 | 3.7 | 1.1 |
| Construction of buildings | 170 | 3.4 | 0.9 |
| Dentists | 162 | 3.5 | 0.9 |
| Health and medical | 448 | 3.7 | 2.5 |
| Hospitals | 186 | 3.4 | 1.0 |
| Cafes | 218 | 3.8 | 1.2 |
| Japanese restaurants | 263 | 3.8 | 1.4 |
| Pharmacies and drug stores | 241 | 3.5 | 1.3 |
| Public parks | 408 | 3.5 | 2.2 |
| Area of Tsu, Mie | 711.1 km² |
| Population | 181,500 |
| Male Population | 88,063 (48.5%) |
| Female Population | 93,437 (51.5%) |
| Population change from 1975 to 2015 | -0.3% |
| Population change from 2000 to 2015 | -4.2% |
| Median Age | 46.2 |
| Male Median Age | 44.3 |
| Female Median Age | 47.9 |
| Area Codes | 59 |
| Neighborhoods | Komeicho |
| Local Time | Sunday 12:54 PM |
| Timezone | Japan Standard Time |
| Lat & Lng | 34.73333° / 136.51667° |
| Postal Codes | 510, 511, 514, 515, 518, More |
Tsu, Mie - Map
Tsu, Mie Population
Years 1975 to 2015| Data | 1975 | 1990 | 2000 | 2015 |
|---|---|---|---|---|
| Population | 182,107 | 194,074 | 189,399 | 181,500 |
| Population Density | 256.1 / km² | 272.9 / km² | 266.3 / km² | 255.2 / km² |
Tsu, Mie Population change from 2000 to 2015
Decrease of 4.2% from year 2000 to 2015| Location | Change since 1975 | Change since 1990 | Change since 2000 |
|---|---|---|---|
| Tsu, Mie | -0.3% | -6.5% | -4.2% |
| Mie Prefecture | +7.5% | -0.7% | -1.9% |
| Japan | +13.6% | +3.4% | +0.6% |
Tsu, Mie Median Age
Median Age: 46.2 years| Location | Median Age | Median Age (Female) | Median Age (Male) |
|---|---|---|---|
| Tsu, Mie | 46.2 years | 47.9 years | 44.3 years |
| Mie Prefecture | 46 years | 47.8 years | 44.1 years |
| Japan | 45.2 years | 46.9 years | 43.5 years |
Tsu, Mie Population Tree
Population By Age and Gender| Age | Male | Female | Total |
|---|---|---|---|
| Under 5 | 3,811 | 3,733 | 7,544 |
| 5-9 | 4,166 | 3,886 | 8,052 |
| 10-14 | 4,305 | 4,144 | 8,449 |
| 15-19 | 4,532 | 4,385 | 8,918 |
| 20-24 | 4,840 | 4,731 | 9,571 |
| 25-29 | 4,874 | 4,682 | 9,556 |
| 30-34 | 5,701 | 5,399 | 11,101 |
| 35-39 | 6,707 | 6,557 | 13,264 |
| 40-44 | 5,942 | 5,848 | 11,791 |
| 45-49 | 5,752 | 5,757 | 11,509 |
| 50-54 | 5,440 | 5,513 | 10,953 |
| 55-59 | 5,879 | 6,047 | 11,926 |
| 60-64 | 6,784 | 7,231 | 14,015 |
| 65-69 | 5,670 | 6,163 | 11,833 |
| 70-74 | 4,862 | 5,628 | 10,491 |
| 75-79 | 4,283 | 5,225 | 9,509 |
| 80-84 | 2,938 | 4,171 | 7,110 |
| 85 Plus | 1,577 | 4,339 | 5,917 |
Tsu, Mie Population Density
Population Density: 255.2 / km²| Location | Population | Area | Population Density |
|---|---|---|---|
| Tsu, Mie | 181,500 | 711.1 km² | 255.2 / km² |
| Mie Prefecture | 1.8 million | 5,778.1 km² | 310.3 / km² |
| Japan | 122.9 million | 373,410.9 km² | 329.2 / km² |
Tsu, Mie Historical Population
Estimated Population from 500 to 2015Sources:
1. JRC (European Commission's Joint Research Centre) work on the GHS built-up grid
2. CIESIN (Center for International Earth Science Information Network)
3. [Link] Klein Goldewijk, K., Beusen, A., Doelman, J., and Stehfest, E.: Anthropogenic land use estimates for the Holocene – HYDE 3.2, Earth Syst. Sci. Data, 9, 927–953, https://doi.org/10.5194/essd-9-927-2017, 2017.
Area Codes
Percentage Area Codes used by businesses in Tsu, Mie Area Code 59: 93.2%
Area Code 120: 5.4%
Other: 1.4%
Business distribution by price for Tsu, Mie
Moderate: 58%
Inexpensive: 37.8%
Expensive: 3.9%
Very Expensive: 0.3%
Human Development Index (HDI)
Statistic composite index of life expectancy, education, and per capita income.Sources: [Link] Kummu, M., Taka, M. & Guillaume, J. Gridded global datasets for Gross Domestic Product and Human Development Index over 1990–2015. Sci Data 5, 180004 (2018) doi:10.1038/sdata.2018.4
Tsu, Mie CO2 Emissions
Carbon Dioxide (CO2) Emissions Per Capita in Tonnes Per Year| Location | CO2 Emissions | CO2 Emissions Per Capita | CO2 Emissions Intensity |
|---|---|---|---|
| Tsu, Mie | 509,457 tn | 2.81 tn | 716.4 tons/km² |
| Mie Prefecture | 5,489,253 tn | 3.06 tn | 950 tons/km² |
| Japan | 541,995,101 tn | 4.41 tn | 1,451 tons/km² |
Tsu, Mie CO2 Emissions
| 2013 CO2 emissions (tonnes/year) | 509,457 tn |
| 2013 CO2 emissions (tonnes/year) per capita | 2.81 tn |
| 2013 CO2 emissions intensity (tonnes/km²/year) | 716.4 tons/km² |
Natural Hazards Risk
Relative risk out of 10| Cyclone | High (10) |
| Flood | Medium (4) |
| Earthquake | High (8) |
* Risk, particularly concerning flood or landslide, may not be for the entire area.
Sources: 1. Dilley, M., R.S. Chen, U. Deichmann, A.L. Lerner-Lam, M. Arnold, J. Agwe, P. Buys, O. Kjekstad, B. Lyon, and G. Yetman. 2005. Natural Disaster Hotspots: A Global Risk Analysis. Washington, D.C.: World Bank. https://doi.org/10.1596/0-8213-5930-4.
2. Center for Hazards and Risk Research - CHRR - Columbia University, Center for International Earth Science Information Network - CIESIN - Columbia University. 2005. Global Flood Hazard Frequency and Distribution. Palisades, NY: NASA Socioeconomic Data and Applications Center (SEDAC). https://doi.org/10.7927/H4668B3D.
3. Center for Hazards and Risk Research - CHRR - Columbia University, Center for International Earth Science Information Network - CIESIN - Columbia University. 2005. Global Earthquake Hazard Distribution - Peak Ground Acceleration. Palisades, NY: NASA Socioeconomic Data and Applications Center (SEDAC). https://doi.org/10.7927/H4BZ63ZS.
4. Center for Hazards and Risk Research - CHRR - Columbia University, Center for International Earth Science Information Network - CIESIN - Columbia University, International Bank for Reconstruction and Development - The World Bank, and United Nations Environment Programme Global Resource Information Database Geneva - UNEP/GRID-Geneva. 2005. Global Cyclone Hazard Frequency and Distribution. Palisades, NY: NASA Socioeconomic Data and Applications Center (SEDAC). https://doi.org/10.7927/H4CZ353K.
Recent Nearby Earthquakes
Magnitude 3.0 and greater| Date | Time | Magnitude | Distance | Depth | Location | Link |
|---|---|---|---|---|---|---|
| 9/14/18 | 7:36 PM | 4 | 20.1 km | 335,090 m | 16km ENE of Matsuzaka, Japan | usgs.gov |
| 11/10/16 | 8:53 PM | 4.7 | 36.9 km | 348,860 m | 4km WNW of Toba, Japan | usgs.gov |
| 11/4/13 | 7:40 PM | 4.2 | 33.3 km | 348,730 m | 7km SSE of Ueno, Japan | usgs.gov |
| 1/29/12 | 9:01 AM | 4.7 | 35.1 km | 330,700 m | western Honshu, Japan | usgs.gov |
| 6/9/09 | 9:07 PM | 5.1 | 32.4 km | 351,500 m | western Honshu, Japan | usgs.gov |
| 9/18/08 | 6:29 AM | 4.7 | 28.6 km | 324,200 m | western Honshu, Japan | usgs.gov |
| 10/15/07 | 6:16 PM | 4.8 | 33.8 km | 328,200 m | western Honshu, Japan | usgs.gov |
| 6/13/07 | 12:58 PM | 4 | 39.7 km | 10,000 m | western Honshu, Japan | usgs.gov |
| 4/15/07 | 2:34 AM | 4.3 | 18.5 km | 16,500 m | western Honshu, Japan | usgs.gov |
| 4/14/07 | 8:19 PM | 5.1 | 26.7 km | 15,700 m | western Honshu, Japan | usgs.gov |
Find historical earthquake occurrences near Tsu, Mie
Earliest Date Latest Date
Magnitude 3.0 and greater Magnitude 4.0 and greater Magnitude 5.0 and greater

Tsu, Mie
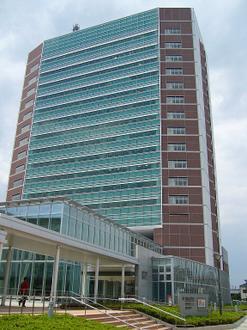
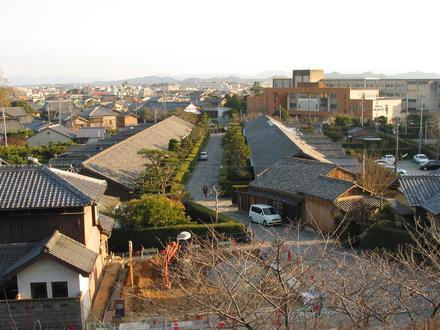
Tsu (津市, Tsu-shi) is the capital city of Mie Prefecture, Japan. of August 2015, the city had an estimated population of 279,304 and a population density of 393 persons per km2. The total area was 711.11 square kilometres (274.56 sq mi). Tsu, Mie Wikipedia Page
Postal Codes
Percentage of businesses by Postal Codes in Tsu, Mie Postal Code 514: 82.6%
Postal Code 515: 7.7%
Other: 9.7%
About Our Data
The data on this page is estimated using a number of publicly available tools and resources. It is provided without warranty, and could contain inaccuracies. Use at your own risk. See here for more information.