Categories in Bukonys
Bukonys Facts
| Area | 142.8 km² |
| Population | 1,146 |
| Male Population | 540 (47.1%) |
| Female Population | 606 (52.9%) |
| Population change (1975 to 2020) | +8.9% |
| Population change (2000 to 2020) | -14.2% |
| Median Age | 38.9 years (Male: 36.3, Female: 41.4) |
| Neighborhoods | Bukonys |
| Local Time | |
| Timezone | Eastern European Summer Time |
| Lat & Lng | 55.21667, 24.36667 |
| Postal Codes | 55411, 55414, 55415, 55416, 55418, More |
Map of Bukonys
Interactive Map
Bukonys Population
Years 1975 to 2020
| Data | 1975 | 1990 | 2000 | 2015 | 2020 |
|---|---|---|---|---|---|
| Population | 1,052 | 1,329 | 1,335 | 1,203 | 1,146 |
| Population Density | 7.4 / km² | 9.3 / km² | 9.4 / km² | 8.4 / km² | 8 / km² |
Sources: JRC (European Commission's Joint Research Centre) work on the GHS built-up grid
Bukonys Population change from 2000 to 2015
Decrease of 9.9% from year 2000 to 2015
| Location | Change since 1975 | Change since 1990 | Change since 2000 |
|---|---|---|---|
| Bukonys | +14.4% | -9.5% | -9.9% |
| Lithuania | -12.8% | -22.2% | -17.4% |
Sources: JRC (European Commission's Joint Research Centre) work on the GHS built-up grid
Bukonys Median Age
Median Age: 38.9 years
| Location | Median Age | Median Age (Female) | Median Age (Male) |
|---|---|---|---|
| Bukonys | 38.9 yrs | 41.4 yrs | 36.3 yrs |
| Lithuania | 39.7 yrs | 42.1 yrs | 37 yrs |
Sources: CIESIN (Center for International Earth Science Information Network)
Bukonys Population Density
Population Density: 8 / km²
| Location | Population | Area | Density |
|---|---|---|---|
| Bukonys | 1,146 | 142.8 km² | 8 / km² |
| Lithuania | 2.9 million | 65,263.1 km² | 44.1 / km² |
Sources: JRC (European Commission's Joint Research Centre) work on the GHS built-up grid
Bukonys Historical and Projected Population
Estimated Population from 0 to 2100
Sources:
- JRC (European Commission's Joint Research Centre) work on the GHS built-up grid
- CIESIN (Center for International Earth Science Information Network)
- [Link] Klein Goldewijk, K., Beusen, A., Doelman, J., and Stehfest, E.: Anthropogenic land use estimates for the Holocene – HYDE 3.2, Earth Syst. Sci. Data, 9, 927–953, https://doi.org/10.5194/essd-9-927-2017, 2017.
Human Development Index (HDI)
Statistic composite index of life expectancy, education, and per capita income.
Source: [Link] Kummu, M., Taka, M. &Guillaume, J. Gridded global datasets for Gross Domestic Product and Human Development Index over 1990–2015. Sci Data 5, 180004 (2018) doi:10.1038/sdata.2018.4
Bukonys CO2 Emissions
Carbon Dioxide (CO2) Emissions Per Capita in Tonnes Per Year
| Location | CO2 Emissions | CO2 Emissions Per Capita | CO2 Emissions Intensity |
|---|---|---|---|
| Bukonys | 9,921 tn | 8.66 tn | 69.5 tons/km² |
| Lithuania | 23,559,934 tn | 8.18 tn | 361 tons/km² |
Sources: [Link] Moran, D., Kanemoto K; Jiborn, M., Wood, R., Többen, J., and Seto, K.C. (2018) Carbon footprints of 13,000 cities. Environmental Research Letters DOI: 10.1088/1748-9326/aac72a
Bukonys CO2 Emissions
| 2013 CO2 emissions (tonnes/year) | 9,921 tn |
| 2013 CO2 emissions (tonnes/year) per capita | 8.66 tn |
| 2013 CO2 emissions intensity (tonnes/km²/year) | 69.5 tons/km² |
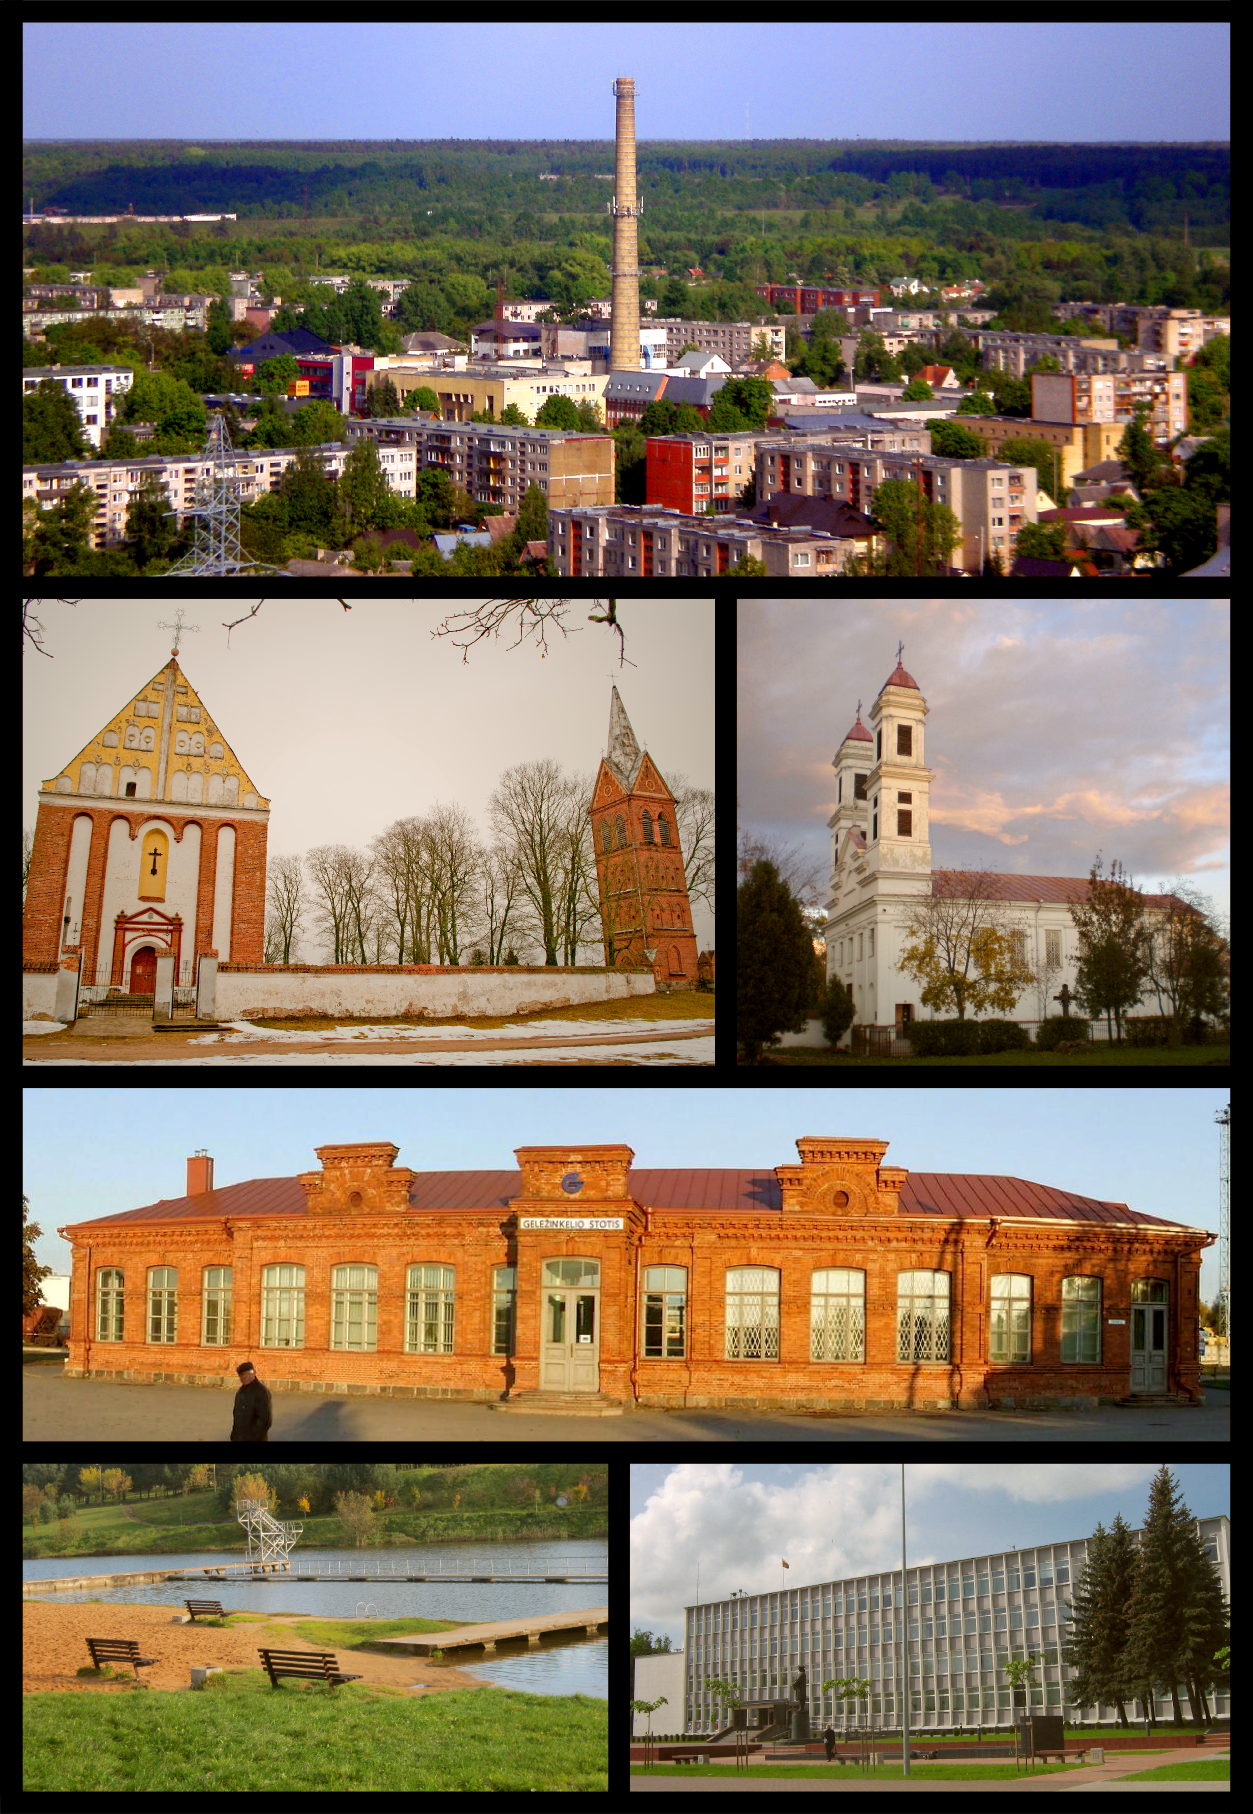
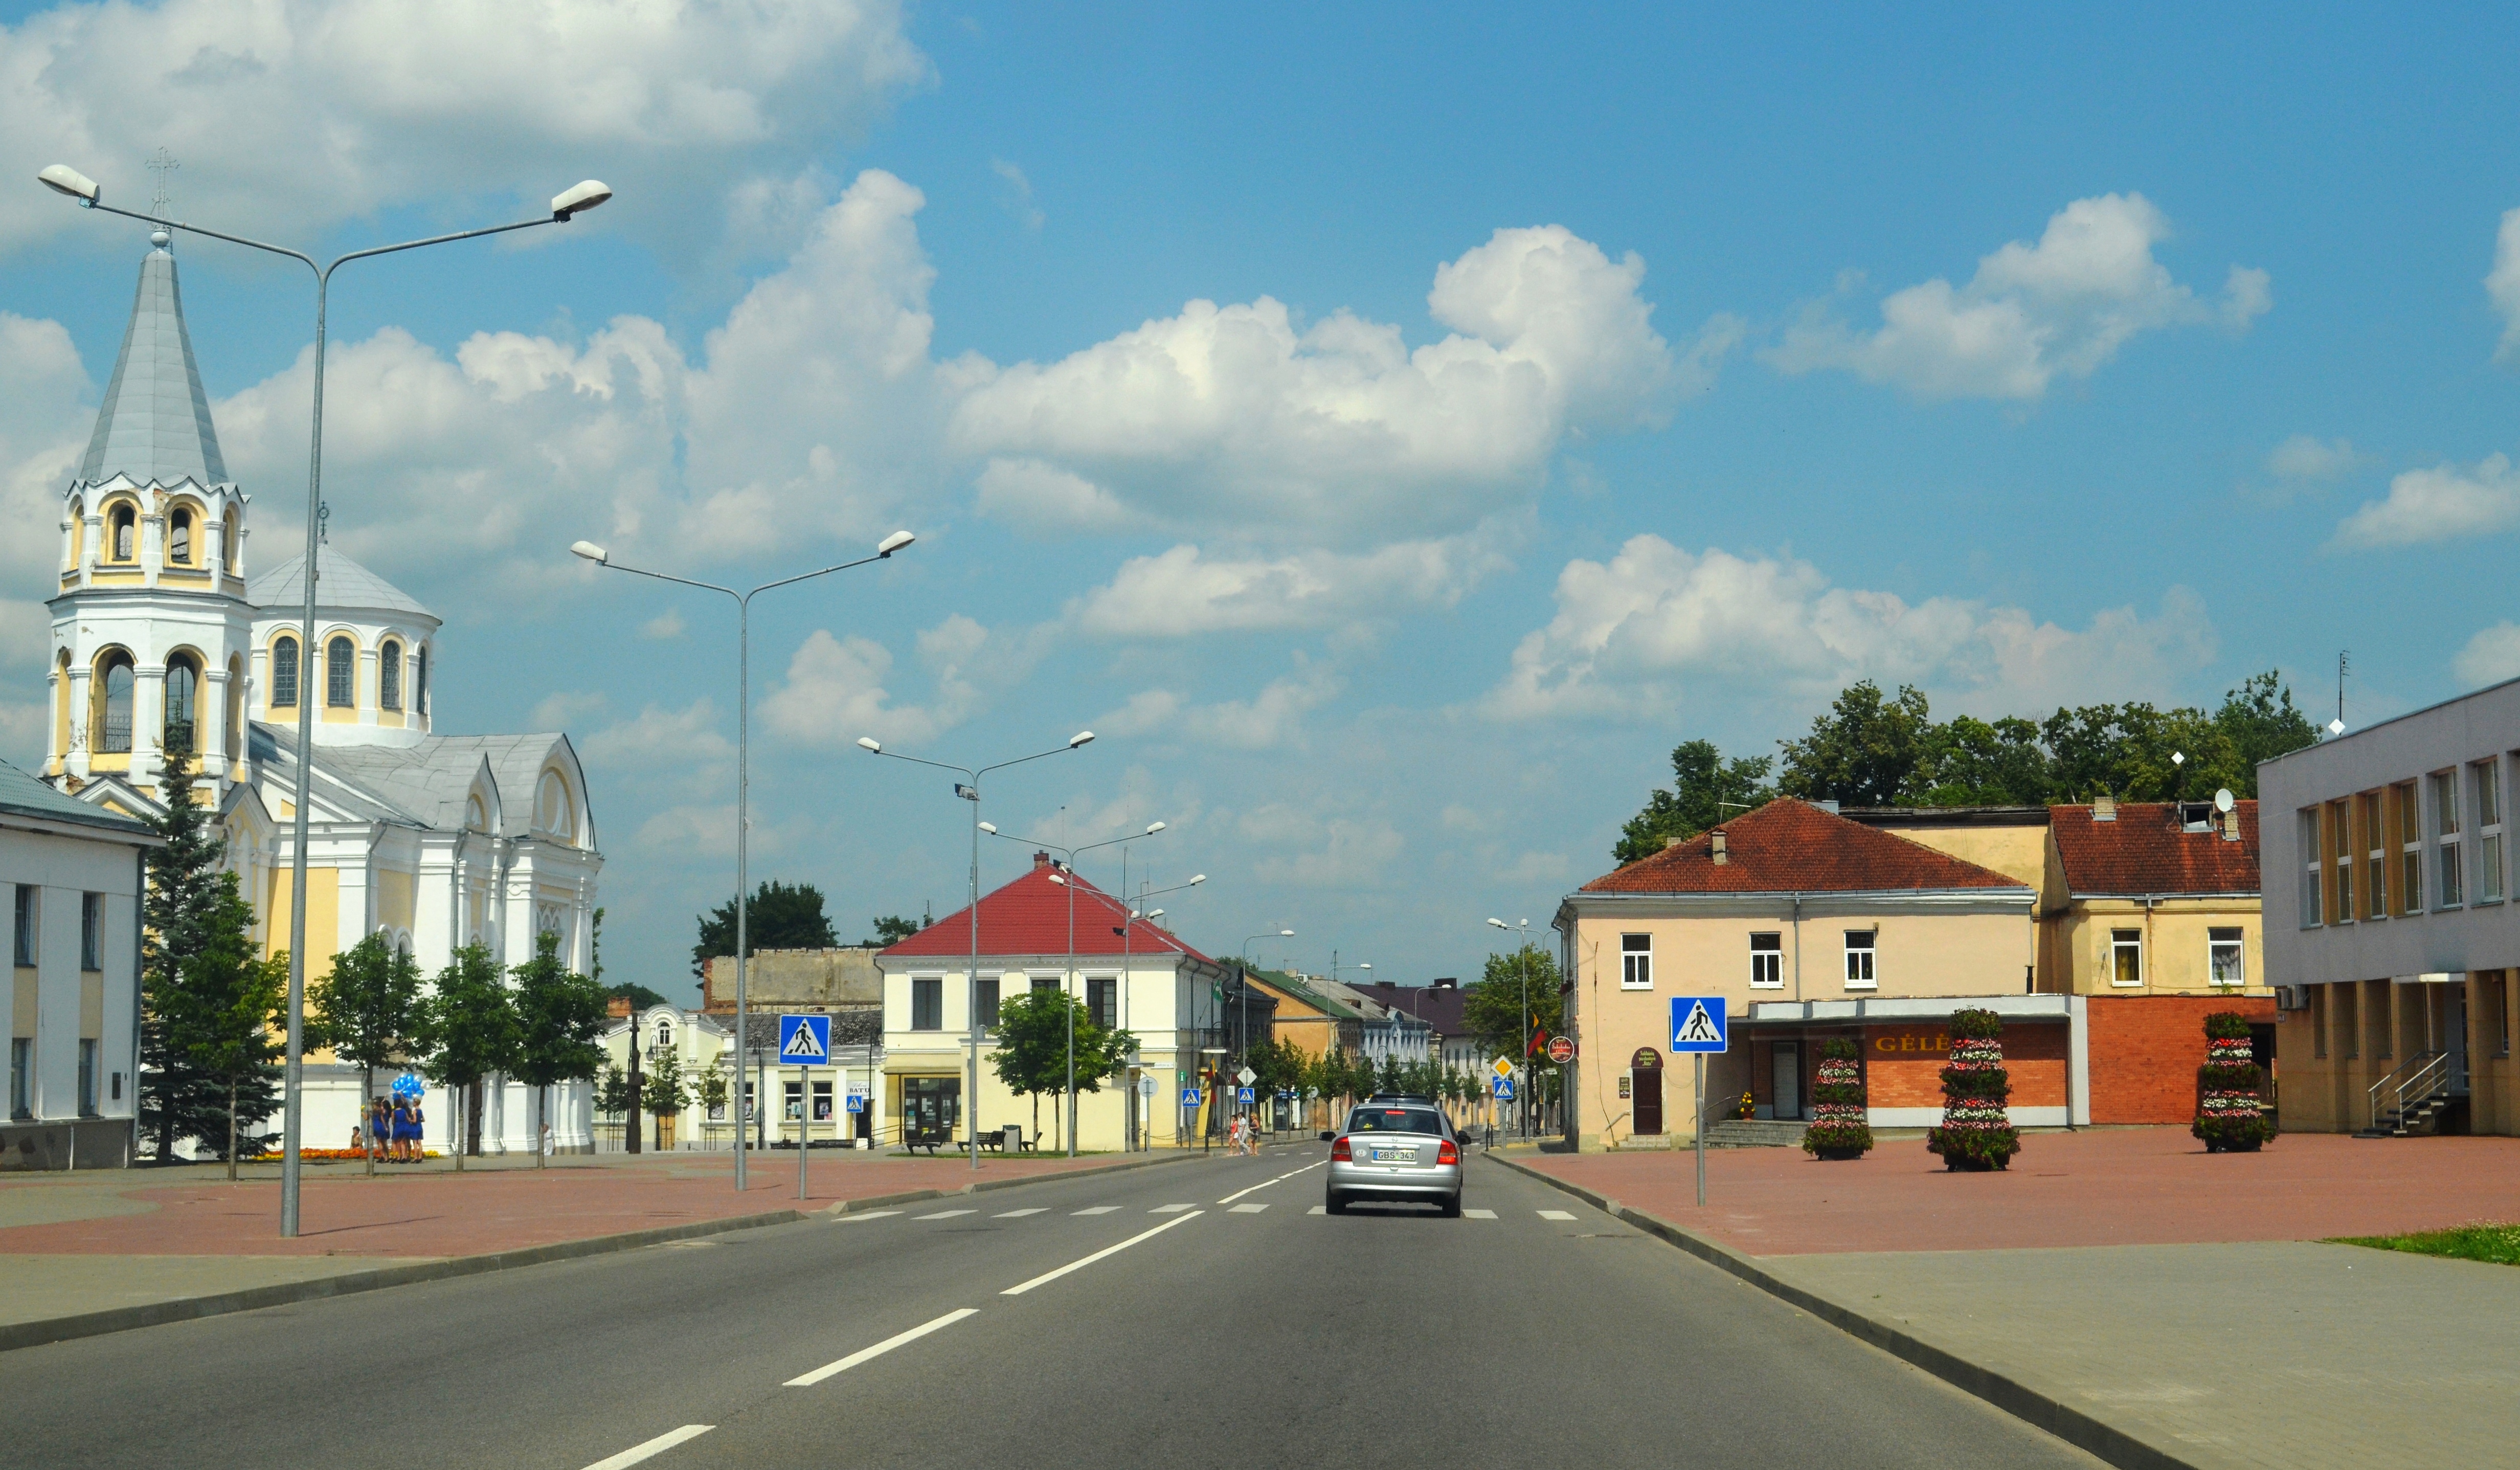
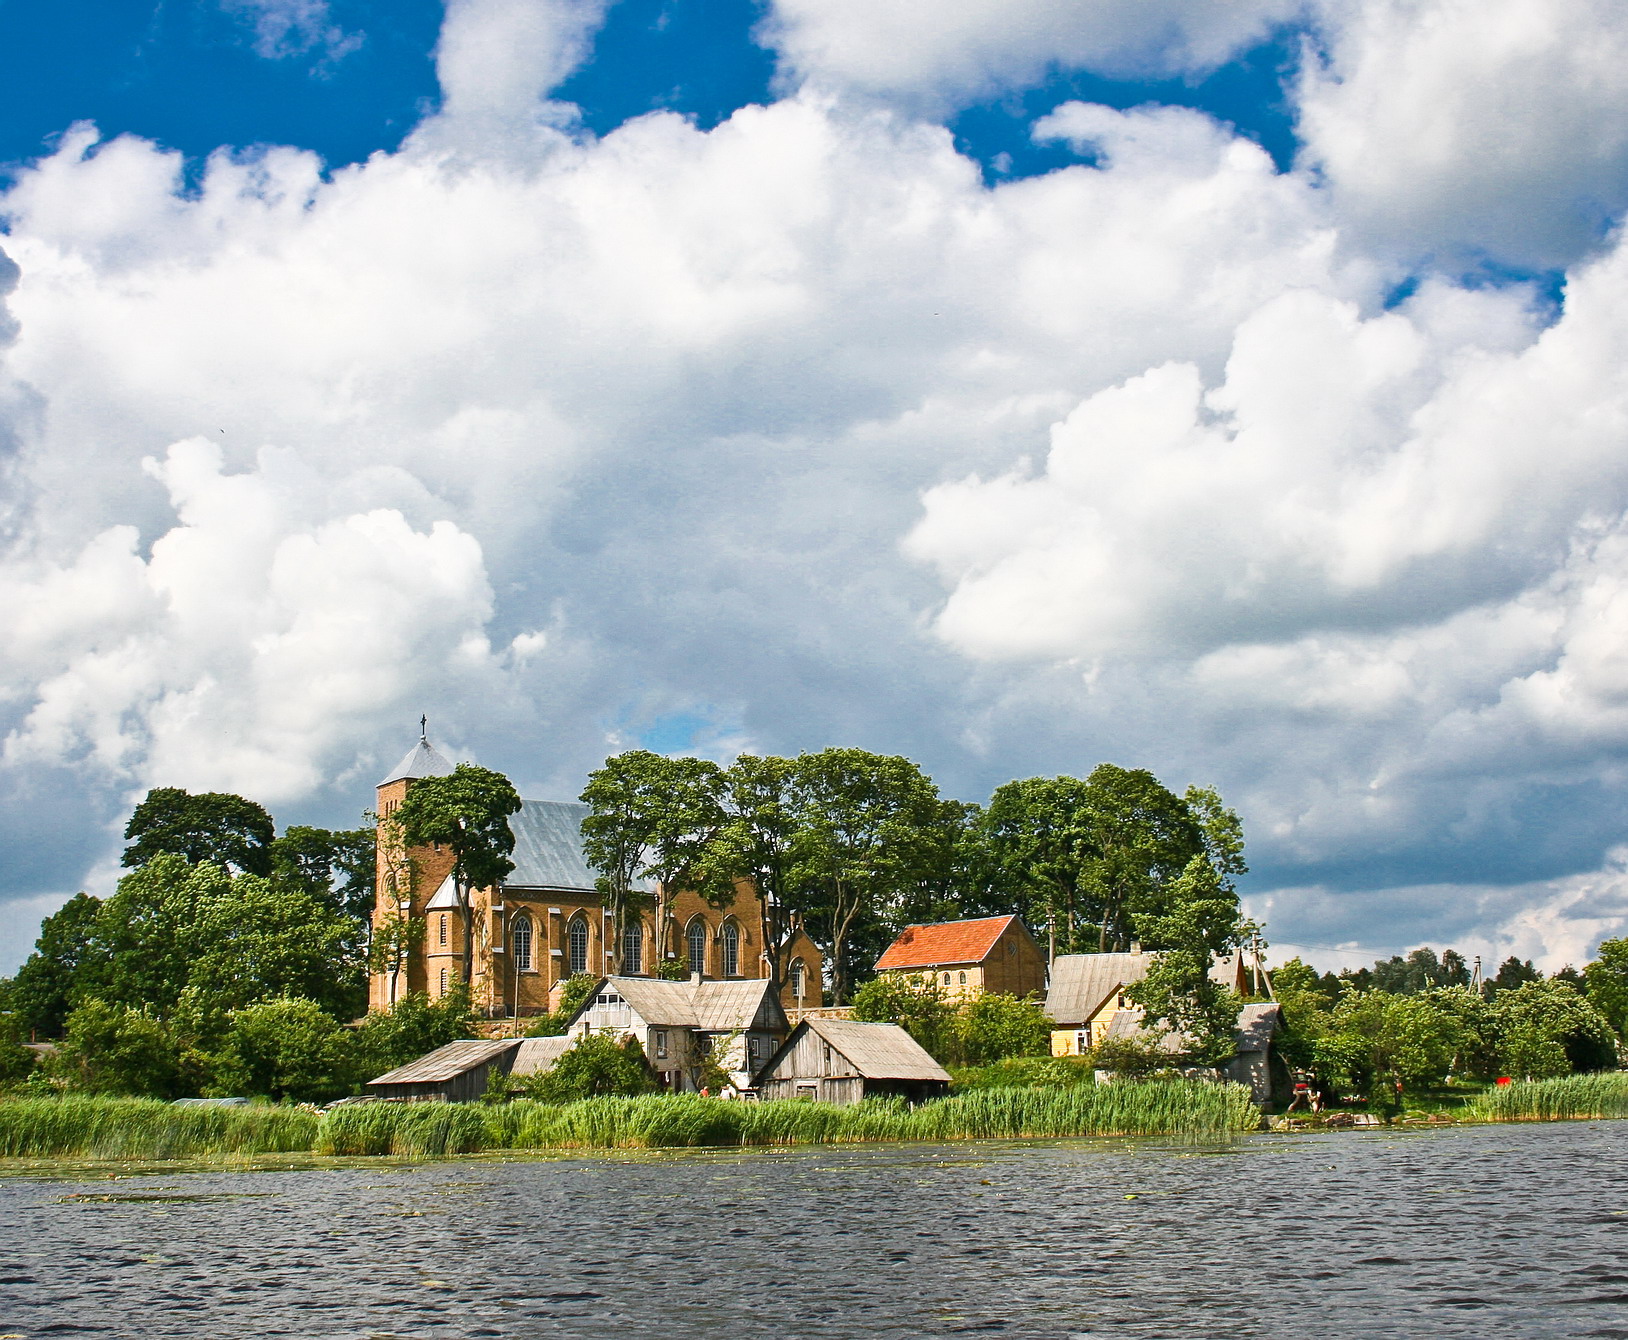
Bukonys
Bukonys is a village in Jonava district municipality, in Kaunas County, in central Lithuania. According to the 2001 census, the village has a population of 657 people.
Bukonys Wikipedia Page
About Our Data
The data on this page is estimated using a number of publicly available tools and resources. It is provided without warranty, and could contain inaccuracies. Use at your own risk.