Businesses in Gharyan
| Area of Gharyan, Jabal al Gharbi District | 7.8 km² |
| Population | 28,503 |
| Population change from 1975 to 2015 | +385% |
| Population change from 2000 to 2015 | -4.7% |
| Area Codes | 41 |
| Local Time | Saturday 4:27 PM |
| Timezone | Eastern European Standard Time |
| Lat & Lng | 32.17222° / 13.02028° |
Gharyan, Jabal al Gharbi District - Map
Gharyan, Jabal al Gharbi District Population
Years 1975 to 2015| Data | 1975 | 1990 | 2000 | 2015 |
|---|---|---|---|---|
| Population | 5,877 | 31,282 | 29,906 | 28,503 |
| Population Density | 754.3 / km² | 4,015 / km² | 3,838 / km² | 3,658 / km² |
Gharyan Population change from 2000 to 2015
Decrease of 4.7% from year 2000 to 2015| Location | Change since 1975 | Change since 1990 | Change since 2000 |
|---|---|---|---|
| Gharyan, Jabal al Gharbi District | +385% | -8.9% | -4.7% |
| Mizdah District | +141% | +42.8% | +17.7% |
| Libya | +139.4% | +43% | +17.7% |
Gharyan, Jabal al Gharbi District Population Density
Population Density: 3,658 / km²| Location | Population | Area | Population Density |
|---|---|---|---|
| Gharyan, Jabal al Gharbi District | 28,503 | 7.8 km² | 3,658 / km² |
| Mizdah District | 334,692 | 76,694.3 km² | 4.36 / km² |
| Libya | 6.2 million | 1,614,874.2 km² | 3.85 / km² |
Gharyan, Jabal al Gharbi District Historical Population
Estimated Population from 1880 to 2015Sources:
1. JRC (European Commission's Joint Research Centre) work on the GHS built-up grid
2. CIESIN (Center for International Earth Science Information Network)
3. [Link] Klein Goldewijk, K., Beusen, A., Doelman, J., and Stehfest, E.: Anthropogenic land use estimates for the Holocene – HYDE 3.2, Earth Syst. Sci. Data, 9, 927–953, https://doi.org/10.5194/essd-9-927-2017, 2017.
Human Development Index (HDI)
Statistic composite index of life expectancy, education, and per capita income.Sources: [Link] Kummu, M., Taka, M. & Guillaume, J. Gridded global datasets for Gross Domestic Product and Human Development Index over 1990–2015. Sci Data 5, 180004 (2018) doi:10.1038/sdata.2018.4
Gharyan, Jabal al Gharbi District CO2 Emissions
Carbon Dioxide (CO2) Emissions Per Capita in Tonnes Per Year| Location | CO2 Emissions | CO2 Emissions Per Capita | CO2 Emissions Intensity |
|---|---|---|---|
| Gharyan, Jabal al Gharbi District | 112,940 tn | 3.96 tn | 14,496 tons/km² |
| Mizdah District | 1,326,190 tn | 3.96 tn | 17.3 tons/km² |
| Libya | 24,635,445 tn | 3.96 tn | 15.3 tons/km² |
Gharyan, Jabal al Gharbi District CO2 Emissions
| 2013 CO2 emissions (tonnes/year) | 112,940 tn |
| 2013 CO2 emissions (tonnes/year) per capita | 3.96 tn |
| 2013 CO2 emissions intensity (tonnes/km²/year) | 14,496 tons/km² |
Natural Hazards Risk
Relative risk out of 10| Earthquake | Medium (4) |
* Risk, particularly concerning flood or landslide, may not be for the entire area.
Sources: 1. Dilley, M., R.S. Chen, U. Deichmann, A.L. Lerner-Lam, M. Arnold, J. Agwe, P. Buys, O. Kjekstad, B. Lyon, and G. Yetman. 2005. Natural Disaster Hotspots: A Global Risk Analysis. Washington, D.C.: World Bank. https://doi.org/10.1596/0-8213-5930-4.
2. Center for Hazards and Risk Research - CHRR - Columbia University, Center for International Earth Science Information Network - CIESIN - Columbia University. 2005. Global Earthquake Hazard Distribution - Peak Ground Acceleration. Palisades, NY: NASA Socioeconomic Data and Applications Center (SEDAC). https://doi.org/10.7927/H4BZ63ZS.
Recent Nearby Earthquakes
Magnitude 3.0 and greater| Date | Time | Magnitude | Distance | Depth | Location | Link |
|---|---|---|---|---|---|---|
| 5/10/13 | 9:42 PM | 4.7 | 91.3 km | 10,000 m | 12km WSW of Sabratah, Libya | usgs.gov |

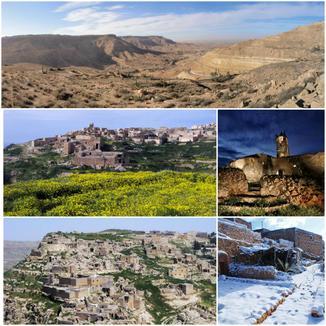
Gharyan, Jabal al Gharbi District
Gharyan (Arabic: غريان) is a City in northwestern Libya, in Jabal al Gharbi District. Prior to 2007 it was the administrative seat of Gharyan District. Gharyan is one of the largest towns in the Nafusa Mountains, an area populated primarily by Berbe.. Gharyan Wikipedia Page

About Our Data
The data on this page is estimated using a number of publicly available tools and resources. It is provided without warranty, and could contain inaccuracies. Use at your own risk. See here for more information.