Businesses in Minbu
Hotels & Travel
Restaurants
Automotive
Financial Services
Medical
Beauty & Spas
Community & Government
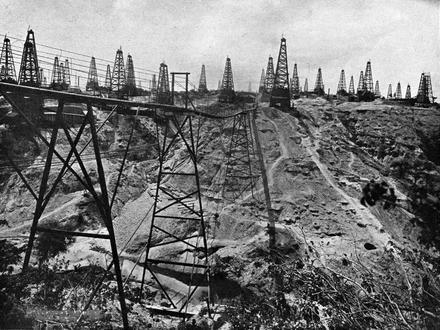
Industries
Business Distribution by Industry Shopping: 24%
Restaurants: 12.9%
Religion: 9.1%
Hotels & Travel: 7.7%
Food: 6.9%
Automotive: 6.1%
Community & Government: 6.1%
Industry: 5.2%
Education: 5.2%
Other: 16.8%
| Area of Minbu, Magway Region | 1.8 km² |
| Population | 14,172 |
| Male Population | 6,647 (46.9%) |
| Female Population | 7,525 (53.1%) |
| Population change from 1975 to 2015 | +730.7% |
| Population change from 2000 to 2015 | -4.8% |
| Median Age | 28.9 |
| Male Median Age | 27.8 |
| Female Median Age | 29.9 |
| Area Codes | 65 |
| Local Time | Friday 9:52 PM |
| Timezone | Myanmar Time |
| Lat & Lng | 20.18059° / 94.87595° |
Minbu, Magway Region - Map
Minbu, Magway Region Population
Years 1975 to 2015| Data | 1975 | 1990 | 2000 | 2015 |
|---|---|---|---|---|
| Population | 1,706 | 7,947 | 14,884 | 14,172 |
| Population Density | 947.9 / km² | 4,415 / km² | 8,269 / km² | 7,874 / km² |
Minbu Population change from 2000 to 2015
Decrease of 4.8% from year 2000 to 2015| Location | Change since 1975 | Change since 1990 | Change since 2000 |
|---|---|---|---|
| Minbu, Magway Region | +730.7% | +78.3% | -4.8% |
| Magway | +771% | +66.4% | +8% |
| Myanmar | +73.5% | +27.5% | +12.8% |
Minbu, Magway Region Median Age
Median Age: 28.9 years| Location | Median Age | Median Age (Female) | Median Age (Male) |
|---|---|---|---|
| Minbu, Magway Region | 28.9 years | 29.9 years | 27.8 years |
| Magway | 29.4 years | 30.6 years | 28.1 years |
| Myanmar | 27.2 years | 28.2 years | 26.1 years |
Minbu, Magway Region Population Tree
Population By Age and Gender| Age | Male | Female | Total |
|---|---|---|---|
| Under 5 | 598 | 583 | 1,181 |
| 5-9 | 658 | 649 | 1,307 |
| 10-14 | 664 | 669 | 1,334 |
| 15-19 | 570 | 619 | 1,189 |
| 20-24 | 532 | 623 | 1,156 |
| 25-29 | 544 | 632 | 1,177 |
| 30-34 | 533 | 608 | 1,142 |
| 35-39 | 488 | 568 | 1,057 |
| 40-44 | 445 | 522 | 967 |
| 45-49 | 400 | 474 | 874 |
| 50-54 | 341 | 406 | 748 |
| 55-59 | 280 | 346 | 626 |
| 60-64 | 211 | 264 | 476 |
| 65-69 | 144 | 187 | 331 |
| 70-74 | 100 | 145 | 245 |
| 75-79 | 78 | 117 | 196 |
| 80-84 | 40 | 67 | 108 |
| 85 Plus | 21 | 46 | 67 |
Minbu, Magway Region Population Density
Population Density: 7,874 / km²| Location | Population | Area | Population Density |
|---|---|---|---|
| Minbu, Magway Region | 14,172 | 1.8 km² | 7,874 / km² |
| Magway | 4.1 million | 44,841 km² | 92.5 / km² |
| Myanmar | 53.1 million | 668,905 km² | 79.4 / km² |
Minbu, Magway Region Historical Population
Estimated Population from 1820 to 2015Sources:
1. JRC (European Commission's Joint Research Centre) work on the GHS built-up grid
2. CIESIN (Center for International Earth Science Information Network)
3. [Link] Klein Goldewijk, K., Beusen, A., Doelman, J., and Stehfest, E.: Anthropogenic land use estimates for the Holocene – HYDE 3.2, Earth Syst. Sci. Data, 9, 927–953, https://doi.org/10.5194/essd-9-927-2017, 2017.
Human Development Index (HDI)
Statistic composite index of life expectancy, education, and per capita income.Sources: [Link] Kummu, M., Taka, M. & Guillaume, J. Gridded global datasets for Gross Domestic Product and Human Development Index over 1990–2015. Sci Data 5, 180004 (2018) doi:10.1038/sdata.2018.4
Minbu, Magway Region CO2 Emissions
Carbon Dioxide (CO2) Emissions Per Capita in Tonnes Per Year| Location | CO2 Emissions | CO2 Emissions Per Capita | CO2 Emissions Intensity |
|---|---|---|---|
| Minbu, Magway Region | 3,045 tn | 0.21 tn | 1,691 tons/km² |
| Magway | 890,442 tn | 0.21 tn | 19.9 tons/km² |
| Myanmar | 11,664,181 tn | 0.22 tn | 17.4 tons/km² |
Minbu, Magway Region CO2 Emissions
| 2013 CO2 emissions (tonnes/year) | 3,045 tn |
| 2013 CO2 emissions (tonnes/year) per capita | 0.21 tn |
| 2013 CO2 emissions intensity (tonnes/km²/year) | 1,691 tons/km² |
Natural Hazards Risk
Relative risk out of 10| Drought | High (10) |
| Earthquake | High (7) |
* Risk, particularly concerning flood or landslide, may not be for the entire area.
Sources: 1. Dilley, M., R.S. Chen, U. Deichmann, A.L. Lerner-Lam, M. Arnold, J. Agwe, P. Buys, O. Kjekstad, B. Lyon, and G. Yetman. 2005. Natural Disaster Hotspots: A Global Risk Analysis. Washington, D.C.: World Bank. https://doi.org/10.1596/0-8213-5930-4.
2. Center for Hazards and Risk Research - CHRR - Columbia University, Center for International Earth Science Information Network - CIESIN - Columbia University. 2005. Global Earthquake Hazard Distribution - Peak Ground Acceleration. Palisades, NY: NASA Socioeconomic Data and Applications Center (SEDAC). https://doi.org/10.7927/H4BZ63ZS.
3. Center for Hazards and Risk Research - CHRR - Columbia University, Center for International Earth Science Information Network - CIESIN - Columbia University, and International Research Institute for Climate and Society - IRI - Columbia University. 2005. Global Drought Hazard Frequency and Distribution. Palisades, NY: NASA Socioeconomic Data and Applications Center (SEDAC). https://doi.org/10.7927/H4VX0DFT.
Recent Nearby Earthquakes
Magnitude 3.0 and greater| Date | Time | Magnitude | Distance | Depth | Location | Link |
|---|---|---|---|---|---|---|
| 11/5/18 | 11:48 AM | 4.6 | 70.5 km | 10,000 m | 13km SSW of Taungdwingyi, Burma | usgs.gov |
| 1/21/17 | 1:49 PM | 4.3 | 42.4 km | 71,980 m | 40km SSW of Magway, Burma | usgs.gov |
| 11/16/14 | 8:34 PM | 5.3 | 81.5 km | 66,000 m | 42km WSW of Chauk, Burma | usgs.gov |
| 11/10/14 | 2:34 AM | 4.6 | 79.2 km | 67,460 m | 32km WNW of Thayetmyo, Burma | usgs.gov |
| 12/23/13 | 8:16 AM | 4.8 | 44.6 km | 93,960 m | 19km WNW of Yenangyaung, Burma | usgs.gov |
| 7/18/13 | 6:53 PM | 4.6 | 81.7 km | 35,400 m | Myanmar | usgs.gov |
| 5/8/12 | 4:12 PM | 4.4 | 21 km | 79,800 m | Myanmar | usgs.gov |
| 2/27/11 | 4:55 PM | 4.6 | 52.7 km | 117,400 m | Myanmar | usgs.gov |
| 2/24/11 | 12:28 AM | 4.7 | 74.5 km | 83,600 m | Myanmar | usgs.gov |
| 1/18/10 | 4:03 PM | 4.6 | 60 km | 99,700 m | Myanmar | usgs.gov |
Find historical earthquake occurrences near Minbu, Magway Region
Earliest Date Latest Date
Magnitude 3.0 and greater Magnitude 4.0 and greater Magnitude 5.0 and greater

Minbu, Magway Region
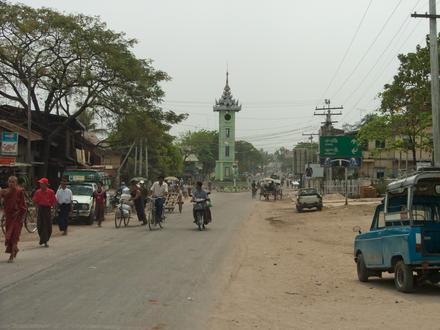
Minbu (Burmese: မင်းဘူးမြို့) is a city in Magwe Division, Myanmar. As of 2014, the city has a urban population of 39000. The area consists of low plain-land towards the Ayeyarwady River, and of undulating country inland rising higher and higher west.. Minbu Wikipedia Page


About Our Data
The data on this page is estimated using a number of publicly available tools and resources. It is provided without warranty, and could contain inaccuracies. Use at your own risk. See here for more information.