Pyuntaza Facts
| Area | 4.4 km² |
| Population | 6,364 |
| Male Population | 3,014 (47.4%) |
| Female Population | 3,350 (52.6%) |
| Population change (1975 to 2020) | +1418.9% |
| Population change (2000 to 2020) | +36.5% |
| Median Age | 25.6 years (Male: 24.3, Female: 26.8) |
| Local Time | |
| Timezone | Myanmar Time |
| Lat & Lng | 17.87780, 96.71835 |
Map of Pyuntaza
Interactive Map
Pyuntaza Population
Years 1975 to 2020
| Data | 1975 | 1990 | 2000 | 2015 | 2020 |
|---|---|---|---|---|---|
| Population | 419 | 2,810 | 4,662 | 6,221 | 6,364 |
| Population Density | 95.8 / km² | 642.3 / km² | 1,065.6 / km² | 1,421.9 / km² | 1,454.6 / km² |
Pyuntaza Population change from 2000 to 2015
Increase of 33.4% from year 2000 to 2015
| Location | Change since 1975 | Change since 1990 | Change since 2000 |
|---|---|---|---|
| Pyuntaza | +1384.7% | +121.4% | +33.4% |
| Bago Region | +1229.6% | +117.2% | +26.7% |
| Myanmar | +73.5% | +27.5% | +12.8% |
Pyuntaza Median Age
Median Age: 25.6 years
| Location | Median Age | Median Age (Female) | Median Age (Male) |
|---|---|---|---|
| Pyuntaza | 25.6 yrs | 26.8 yrs | 24.3 yrs |
| Bago Region | 28.2 yrs | 29.3 yrs | 27 yrs |
| Myanmar | 27.2 yrs | 28.2 yrs | 26.1 yrs |
Pyuntaza Population Density
Population Density: 1,455 / km²
| Location | Population | Area | Density |
|---|---|---|---|
| Pyuntaza | 6,364 | 4.375 km² | 1,455 / km² |
| Bago Region | 5.2 million | 38,788 km² | 134 / km² |
| Myanmar | 53.1 million | 668,905 km² | 79.4 / km² |
Pyuntaza Historical and Projected Population
Estimated Population from 1870 to 2100
- JRC (European Commission's Joint Research Centre) work on the GHS built-up grid
- CIESIN (Center for International Earth Science Information Network)
- [Link] Klein Goldewijk, K., Beusen, A., Doelman, J., and Stehfest, E.: Anthropogenic land use estimates for the Holocene – HYDE 3.2, Earth Syst. Sci. Data, 9, 927–953, https://doi.org/10.5194/essd-9-927-2017, 2017.
Human Development Index (HDI)
Statistic composite index of life expectancy, education, and per capita income.
Pyuntaza CO2 Emissions
Carbon Dioxide (CO2) Emissions Per Capita in Tonnes Per Year
| Location | CO2 Emissions | CO2 Emissions Per Capita | CO2 Emissions Intensity |
|---|---|---|---|
| Pyuntaza | 1,377 tn | 0.22 tn | 314.8 tons/km² |
| Bago Region | 1,099,837 tn | 0.21 tn | 28.4 tons/km² |
| Myanmar | 11,664,181 tn | 0.22 tn | 17.4 tons/km² |
| 2013 CO2 emissions (tonnes/year) | 1,377 tn |
| 2013 CO2 emissions (tonnes/year) per capita | 0.22 tn |
| 2013 CO2 emissions intensity (tonnes/km²/year) | 314.8 tons/km² |
Natural Hazards Risk
Relative risk out of 10
| Hazard | Risk Level |
|---|---|
| Drought | High (10) |
| Earthquake | Medium (6) |
* Risk, particularly concerning flood or landslide, may not be for the entire area.
- Dilley, M., R.S. Chen, U. Deichmann, A.L. Lerner-Lam, M. Arnold, J. Agwe, P. Buys, O. Kjekstad, B. Lyon, and G. Yetman. 2005. Natural Disaster Hotspots: A Global Risk Analysis. Washington, D.C.: World Bank. https://doi.org/10.1596/0-8213-5930-4.
- Center for Hazards and Risk Research - CHRR - Columbia University, Center for International Earth Science Information Network - CIESIN - Columbia University, and International Research Institute for Climate and Society - IRI - Columbia University. 2005. Global Drought Hazard Frequency and Distribution. Palisades, NY: NASA Socioeconomic Data and Applications Center (SEDAC). https://doi.org/10.7927/H4VX0DFT.
- Center for Hazards and Risk Research - CHRR - Columbia University, Center for International Earth Science Information Network - CIESIN - Columbia University. 2005. Global Earthquake Hazard Distribution - Peak Ground Acceleration. Palisades, NY: NASA Socioeconomic Data and Applications Center (SEDAC). https://doi.org/10.7927/H4BZ63ZS.
Recent Nearby Earthquakes
Magnitude 3.0 and greater
| Date▼ | Time↕ | Magnitude↕ | Distance↕ | Depth↕ | Location↕ | Link |
|---|---|---|---|---|---|---|
| 6/18/19 | 4:28 AM | 4.8 | 62.6 km | 16,190 m | 41km ENE of Letpandan, Burma | usgs.gov |
| 1/28/19 | 3:52 AM | 4.5 | 78.4 km | 27,660 m | 45km SW of Pyu, Burma | usgs.gov |
| 6/17/18 | 1:42 PM | 4.6 | 79.2 km | 10,000 m | 33km WSW of Pyu, Burma | usgs.gov |
| 6/17/18 | 1:21 PM | 5 | 81.5 km | 10,000 m | 44km WSW of Pyu, Burma | usgs.gov |
| 4/24/18 | 12:23 PM | 5.1 | 81.4 km | 10,000 m | 33km WSW of Pyu, Burma | usgs.gov |
| 4/22/18 | 6:31 PM | 4.9 | 83.4 km | 10,000 m | 49km WSW of Pyu, Burma | usgs.gov |
| 4/21/18 | 10:41 PM | 4.7 | 84.5 km | 10,000 m | 38km WSW of Pyu, Burma | usgs.gov |
| 4/20/18 | 10:29 PM | 5 | 76.9 km | 17,070 m | 33km WSW of Pyu, Burma | usgs.gov |
| 4/20/18 | 4:16 AM | 4.9 | 79.9 km | 10,000 m | 31km WSW of Pyu, Burma | usgs.gov |
| 4/10/18 | 3:17 AM | 4.3 | 88.1 km | 37,490 m | 53km WSW of Pyu, Burma | usgs.gov |
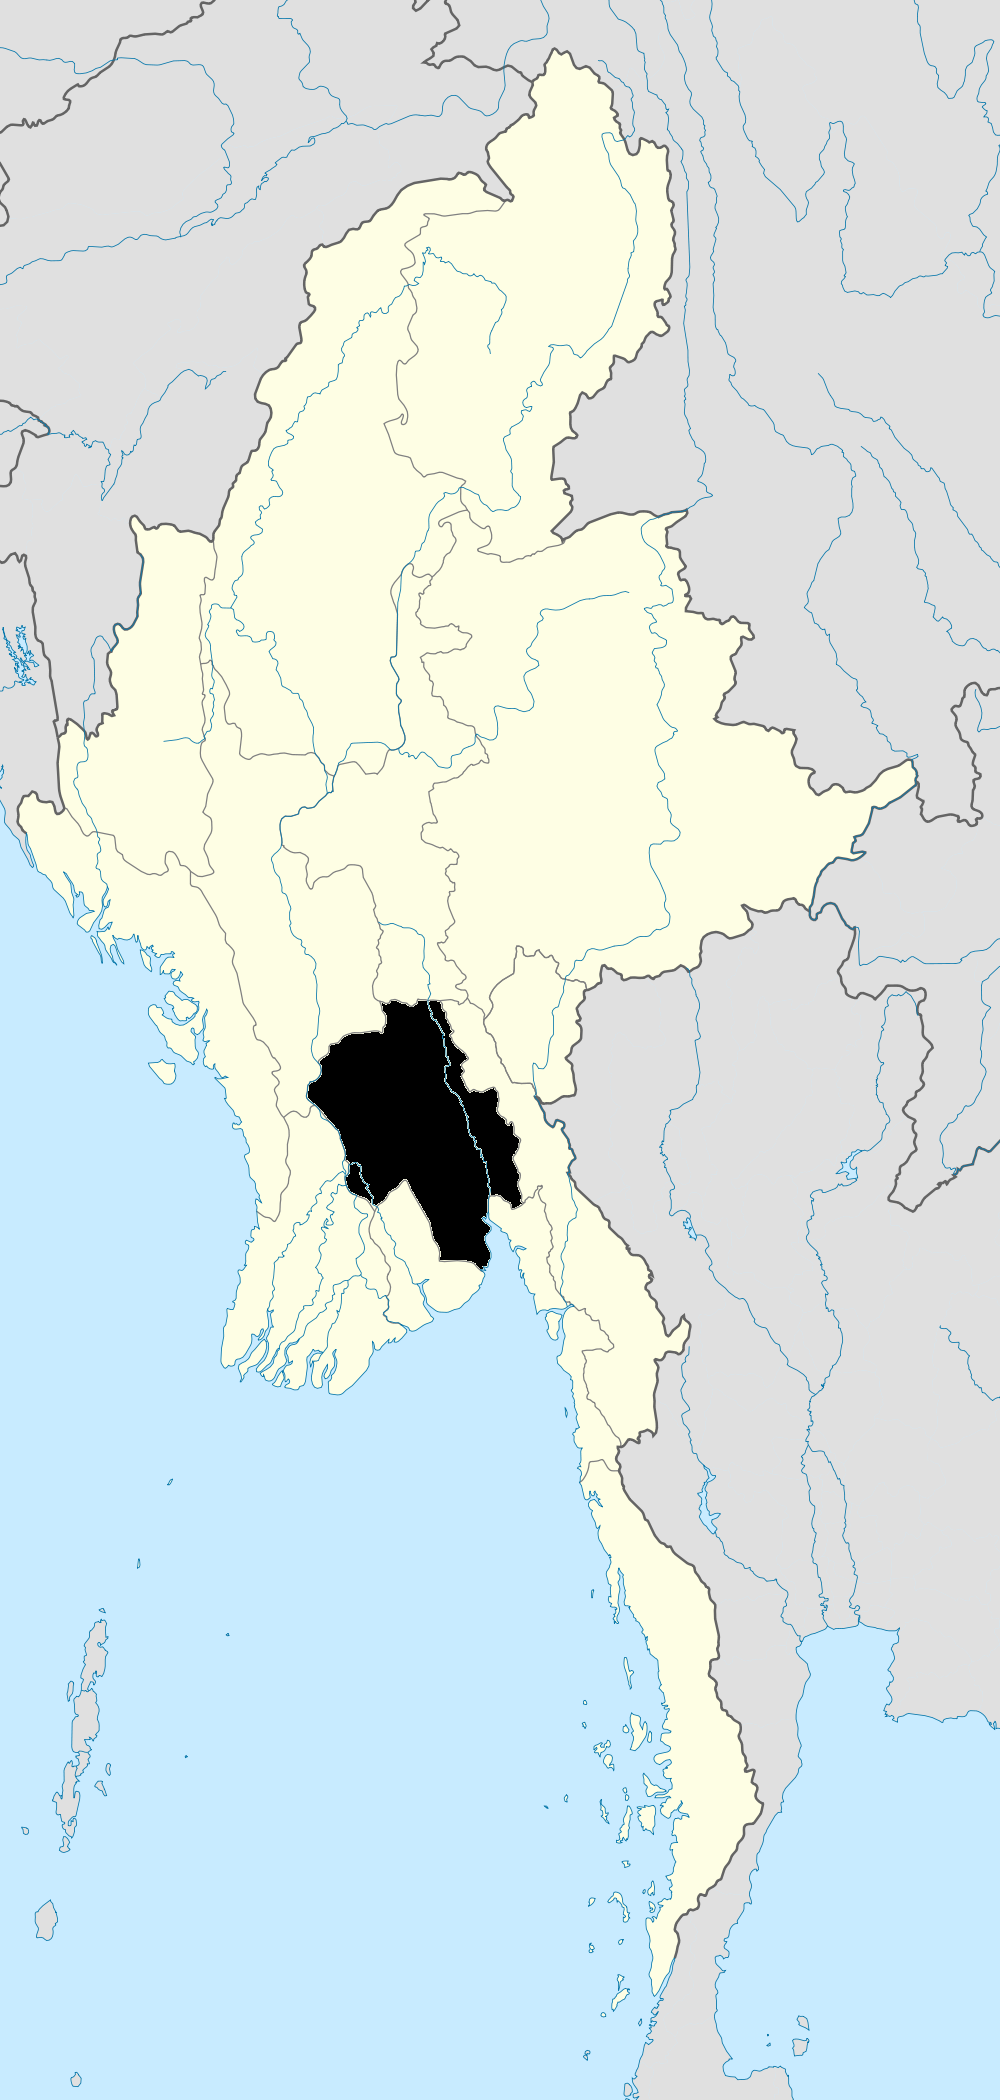
Pyuntaza
Pyuntaza (Burmese: ပြွန်တန်ဆာမြို့; MLCTS: pywan ti cha mrui.; also spelt Pyuntasa) is a small town located in Nyaunglebin Township, Bago District, Bago Region, Myanmar. It is about 70 kilometres (43 mi) from Bago (formerly Pegu). dominant ethnic gr..
Pyuntaza Wikipedia Page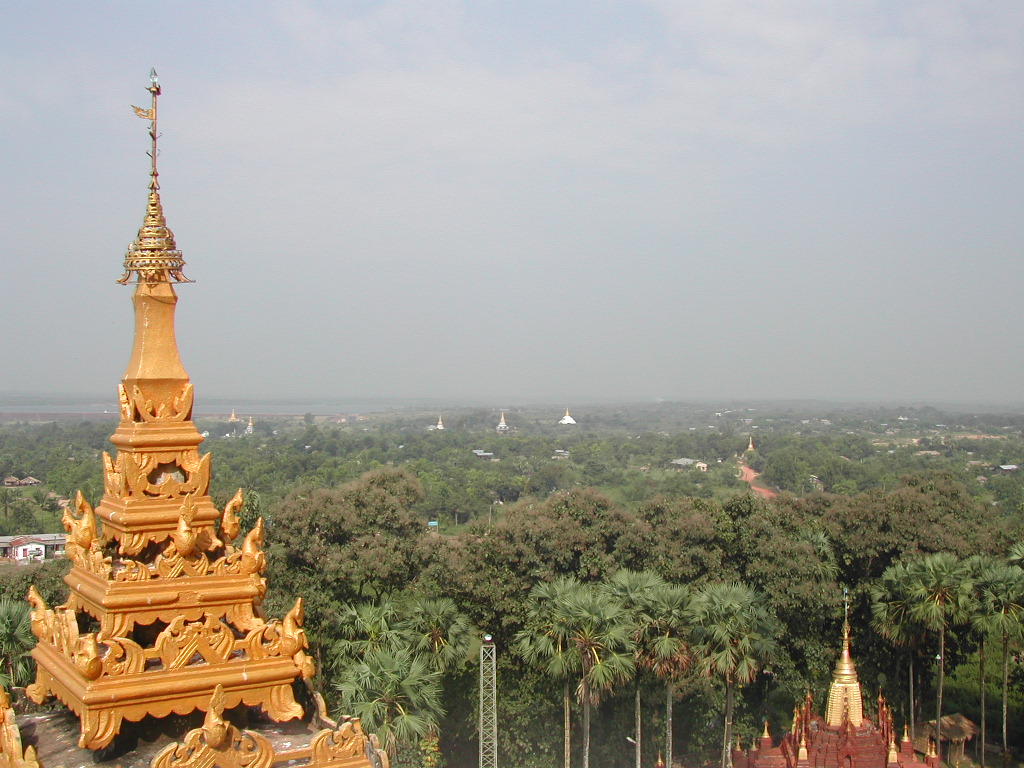
About Our Data
The data on this page is estimated using a number of publicly available tools and resources. It is provided without warranty, and could contain inaccuracies. Use at your own risk.