- World
- »
- MX
- »
- Puebla
- »
- Atlixco, Puebla
Businesses in Atlixco
Hotels & Travel
Restaurants
Automotive
Financial Services
Medical
Beauty & Spas
Community & Government
Industries
Business Distribution by Industry Shopping: 24%
Restaurants: 15.6%
Food: 13.1%
Medical: 5.7%
Professional Services: 5.5%
Automotive: 5.2%
Other: 30.9%
| Industry Description | Number of Establishments | Average Google Rating | Businesses per 1,000 residents |
|---|---|---|---|
| Car parts | 32 | 4.2 | 0.3 |
| Car repair | 66 | 4.2 | 0.7 |
| Public administration | 48 | 3.8 | 0.5 |
| Secondary education | 28 | 3.8 | 0.3 |
| Banks | 31 | 3.4 | 0.3 |
| Loan companies | 42 | 3.5 | 0.5 |
| Grocery stores and supermarkets | 61 | 4.0 | 0.7 |
| Real estate | 40 | 4.4 | 0.4 |
| Hotels and motels | 45 | 4.0 | 0.5 |
| Other accommodation | 43 | 4.1 | 0.5 |
| Dentists | 31 | 3.5 | 0.3 |
| Health and medical | 91 | 4.4 | 1.0 |
| Hospitals | 53 | 3.8 | 0.6 |
| Churches | 37 | 4.4 | 0.4 |
| Bars, pubs and taverns | 65 | 4.1 | 0.7 |
| Mexican restaurants | 109 | 4.2 | 1.2 |
| Hardware stores | 63 | 4.2 | 0.7 |
| Nurseries and garden supplies | 44 | 4.4 | 0.5 |
| Pharmacies and drug stores | 35 | 4.0 | 0.4 |
| Area of Atlixco, Puebla | 229.2 km² |
| Population | 92,449 |
| Male Population | 43,132 (46.7%) |
| Female Population | 49,317 (53.3%) |
| Population change from 1975 to 2015 | +63.5% |
| Population change from 2000 to 2015 | +7.5% |
| Median Age | 26.7 |
| Male Median Age | 24.8 |
| Female Median Age | 28.4 |
| Area Codes | 346, 467, 499 |
| Neighborhoods | Centro, Francisco I. Madero, Revolución, Álvaro Obregón |
| Local Time | Saturday 1:58 AM |
| Timezone | Central Daylight Time |
| Lat & Lng | 18.90815° / -98.43613° |
| Postal Codes | 74200, 74210, 74215, 74218, 74220, More |
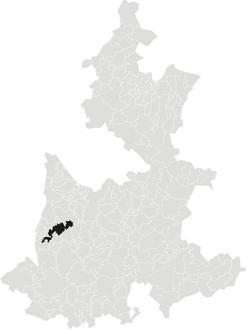
Atlixco, Puebla - Map
Atlixco, Puebla Population
Years 1975 to 2015| Data | 1975 | 1990 | 2000 | 2015 |
|---|---|---|---|---|
| Population | 56,535 | 75,815 | 85,966 | 92,449 |
| Population Density | 246.6 / km² | 330.8 / km² | 375.0 / km² | 403.3 / km² |
Atlixco Population change from 2000 to 2015
Increase of 7.5% from year 2000 to 2015| Location | Change since 1975 | Change since 1990 | Change since 2000 |
|---|---|---|---|
| Atlixco, Puebla | +63.5% | +21.9% | +7.5% |
| Puebla | +99.8% | +40.9% | +18.4% |
| Mexico | +108.7% | +48.4% | +23.5% |
Atlixco, Puebla Median Age
Median Age: 26.7 years| Location | Median Age | Median Age (Female) | Median Age (Male) |
|---|---|---|---|
| Atlixco, Puebla | 26.7 years | 28.4 years | 24.8 years |
| Puebla | 24.5 years | 25.6 years | 23.3 years |
| Mexico | 26.2 years | 27 years | 25.3 years |
Atlixco, Puebla Population Tree
Population By Age and Gender| Age | Male | Female | Total |
|---|---|---|---|
| Under 5 | 4,193 | 4,022 | 8,215 |
| 5-9 | 4,452 | 4,307 | 8,759 |
| 10-14 | 4,553 | 4,350 | 8,904 |
| 15-19 | 4,614 | 4,723 | 9,338 |
| 20-24 | 3,909 | 4,593 | 8,503 |
| 25-29 | 3,309 | 3,882 | 7,192 |
| 30-34 | 2,736 | 3,561 | 6,297 |
| 35-39 | 2,630 | 3,448 | 6,079 |
| 40-44 | 2,296 | 3,180 | 5,476 |
| 45-49 | 2,280 | 2,962 | 5,243 |
| 50-54 | 2,152 | 2,618 | 4,771 |
| 55-59 | 1,745 | 2,042 | 3,787 |
| 60-64 | 1,276 | 1,709 | 2,986 |
| 65-69 | 937 | 1,209 | 2,146 |
| 70-74 | 809 | 989 | 1,798 |
| 75-79 | 581 | 735 | 1,316 |
| 80-84 | 358 | 515 | 874 |
| 85 Plus | 301 | 471 | 772 |
Atlixco, Puebla Population Density
Population Density: 403.3 / km²| Location | Population | Area | Population Density |
|---|---|---|---|
| Atlixco, Puebla | 92,449 | 229.2 km² | 403.3 / km² |
| Puebla | 6.4 million | 34,309.1 km² | 186.5 / km² |
| Mexico | 126.8 million | 1,965,208 km² | 64.5 / km² |
Atlixco, Puebla Historical and Projected Population
Estimated Population from 1720 to 2100Sources:
1. JRC (European Commission's Joint Research Centre) work on the GHS built-up grid
2. CIESIN (Center for International Earth Science Information Network)
3. [Link] Klein Goldewijk, K., Beusen, A., Doelman, J., and Stehfest, E.: Anthropogenic land use estimates for the Holocene – HYDE 3.2, Earth Syst. Sci. Data, 9, 927–953, https://doi.org/10.5194/essd-9-927-2017, 2017.
Neighborhoods
Business Distribution by neighborhood in Atlixco Centro: 37.7%
Álvaro Obregón: 9.5%
Francisco I. Madero: 6.2%
Revolución: 5.7%
Other: 41%
Business distribution by price for Atlixco, Puebla
Inexpensive: 60.6%
Moderate: 30.4%
Expensive: 7.6%
Very Expensive: 1.4%
Human Development Index (HDI)
Statistic composite index of life expectancy, education, and per capita income.Sources: [Link] Kummu, M., Taka, M. & Guillaume, J. Gridded global datasets for Gross Domestic Product and Human Development Index over 1990–2015. Sci Data 5, 180004 (2018) doi:10.1038/sdata.2018.4
Atlixco, Puebla CO2 Emissions
Carbon Dioxide (CO2) Emissions Per Capita in Tonnes Per Year| Location | CO2 Emissions | CO2 Emissions Per Capita | CO2 Emissions Intensity |
|---|---|---|---|
| Atlixco, Puebla | 342,087 tn | 3.7 tn | 1,492 tons/km² |
| Puebla | 22,860,097 tn | 3.57 tn | 666.3 tons/km² |
| Mexico | 496,865,013 tn | 3.92 tn | 252.8 tons/km² |
Atlixco, Puebla CO2 Emissions
| 2013 CO2 emissions (tonnes/year) | 342,087 tn |
| 2013 CO2 emissions (tonnes/year) per capita | 3.7 tn |
| 2013 CO2 emissions intensity (tonnes/km²/year) | 1,492 tons/km² |
Natural Hazards Risk
Relative risk out of 10| Drought | Medium (4) |
| Flood | High (8) |
| Earthquake | Medium (4) |
* Risk, particularly concerning flood or landslide, may not be for the entire area.
Sources: 1. Dilley, M., R.S. Chen, U. Deichmann, A.L. Lerner-Lam, M. Arnold, J. Agwe, P. Buys, O. Kjekstad, B. Lyon, and G. Yetman. 2005. Natural Disaster Hotspots: A Global Risk Analysis. Washington, D.C.: World Bank. https://doi.org/10.1596/0-8213-5930-4.
2. Center for Hazards and Risk Research - CHRR - Columbia University, Center for International Earth Science Information Network - CIESIN - Columbia University. 2005. Global Flood Hazard Frequency and Distribution. Palisades, NY: NASA Socioeconomic Data and Applications Center (SEDAC). https://doi.org/10.7927/H4668B3D.
3. Center for Hazards and Risk Research - CHRR - Columbia University, Center for International Earth Science Information Network - CIESIN - Columbia University. 2005. Global Earthquake Hazard Distribution - Peak Ground Acceleration. Palisades, NY: NASA Socioeconomic Data and Applications Center (SEDAC). https://doi.org/10.7927/H4BZ63ZS.
4. Center for Hazards and Risk Research - CHRR - Columbia University, Center for International Earth Science Information Network - CIESIN - Columbia University, and International Research Institute for Climate and Society - IRI - Columbia University. 2005. Global Drought Hazard Frequency and Distribution. Palisades, NY: NASA Socioeconomic Data and Applications Center (SEDAC). https://doi.org/10.7927/H4VX0DFT.
Recent Nearby Earthquakes
Magnitude 3.0 and greater| Date | Time | Magnitude | Distance | Depth | Location | Link |
|---|---|---|---|---|---|---|
| 9/19/17 | 11:14 AM | 7.1 | 40 km | 48,000 m | 1km E of Ayutla, Mexico | usgs.gov |
| 6/21/13 | 2:41 AM | 4 | 52.7 km | 2,000 m | Morelos, Mexico | usgs.gov |
| 5/6/13 | 1:33 AM | 4.1 | 24.4 km | 1,000 m | Puebla, Mexico | usgs.gov |
| 10/4/08 | 6:40 PM | 3.2 | 43.3 km | 2,000 m | Morelos, Mexico | usgs.gov |
| 8/12/08 | 4:29 PM | 3.8 | 46.2 km | 3,000 m | Tlaxcala, Mexico | usgs.gov |
| 8/8/08 | 7:59 PM | 3.4 | 51 km | 5,000 m | Tlaxcala, Mexico | usgs.gov |
| 11/9/07 | 9:50 PM | 3.4 | 48.6 km | 2,000 m | Puebla, Mexico | usgs.gov |
| 6/19/07 | 11:13 PM | 3.7 | 39.6 km | 1,500 m | Morelos, Mexico | usgs.gov |
| 11/15/06 | 9:03 AM | 3.5 | 21.7 km | 1,000 m | Puebla, Mexico | usgs.gov |
| 6/28/05 | 11:35 PM | 3.2 | 31.3 km | 5,000 m | Estado de Mexico, Mexico | usgs.gov |
Find historical earthquake occurrences near Atlixco, Puebla
Earliest Date Latest Date
Magnitude 3.0 and greater Magnitude 4.0 and greater Magnitude 5.0 and greater

Atlixco, Puebla
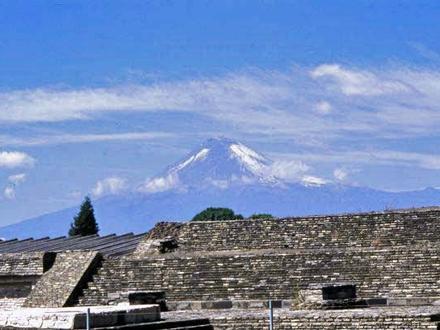
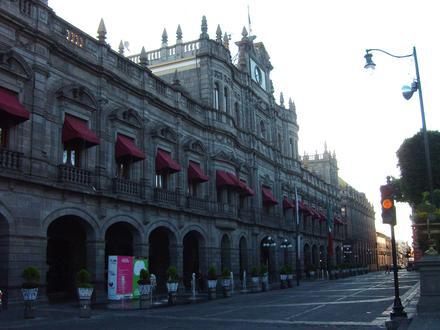
Atlixco (Nahuatl pronunciation: [aːˈt͡ɬiːʃko] is a city and a municipality in the Mexican state of Puebla. It is a regional industrial and commercial center but economically it is much better known for its production of ornamental plants and cut flow.. Atlixco Wikipedia Page
Postal Codes
Percentage of businesses by Postal Codes in Atlixco Postal Code 74200: 40.8%
Postal Code 74260: 10.1%
Postal Code 74290: 8.4%
Postal Code 74270: 6%
Postal Code 74240: 5.3%
Other: 29.4%

About Our Data
The data on this page is estimated using a number of publicly available tools and resources. It is provided without warranty, and could contain inaccuracies. Use at your own risk. See here for more information.