- World
- »
- MX
- »
- Sonora
- »
- Empalme, Sonora
Businesses in Empalme, Sonora
Hotels & Travel
Restaurants
Automotive
Financial Services
Medical
Beauty & Spas
Community & Government
Industries
Business Distribution by Industry Shopping: 21.7%
Restaurants: 16.8%
Food: 14.5%
Education: 6.5%
Industry: 5.9%
Automotive: 5.7%
Professional Services: 5%
Other: 23.9%
| Industry Description | Number of Establishments | Average Google Rating | Businesses per 1,000 residents |
|---|---|---|---|
| Car repair | 17 | 4.4 | 0.4 |
| Gas stations | 10 | 4.0 | 0.2 |
| Public administration | 15 | 3.6 | 0.3 |
| Primary and elementary schools | 11 | 4.2 | 0.2 |
| Banks | 10 | 3.7 | 0.2 |
| Loan companies | 9 | 3.7 | 0.2 |
| Bakeries | 10 | 4.2 | 0.2 |
| Convenience stores | 8 | 3.1 | 0.2 |
| Grocery stores and supermarkets | 20 | 3.9 | 0.4 |
| Buses and trains | 11 | 3.7 | 0.2 |
| Wholesale of machinery | 8 | 0.2 | |
| Cemeteries and crematoriums | 8 | 0.2 | |
| Health and medical | 7 | 4.8 | 0.2 |
| Hospitals | 8 | 3.9 | 0.2 |
| Churches | 7 | 4.8 | 0.2 |
| American restaurants | 8 | 0.2 | |
| Bars, pubs and taverns | 7 | 4.0 | 0.2 |
| Mexican restaurants | 16 | 4.4 | 0.3 |
| Seafood restaurants | 9 | 4.0 | 0.2 |
| Electronics stores | 9 | 4.0 | 0.2 |
| Hardware stores | 12 | 4.9 | 0.3 |
| Pharmacies and drug stores | 8 | 4.3 | 0.2 |
| Area of Empalme, Sonora | 14.3 km² |
| Population | 46,436 |
| Male Population | 22,922 (49.4%) |
| Female Population | 23,515 (50.6%) |
| Population change from 1975 to 2015 | +102.8% |
| Population change from 2000 to 2015 | +16.4% |
| Median Age | 28.2 |
| Male Median Age | 27.3 |
| Female Median Age | 29 |
| Area Codes | 346, 467 |
| Neighborhoods | Colonia Infonavit Guadalupe, Moderna, Jordán, Juárez, Libertad, Moderna, Ortíz Rubio |
| Local Time | Friday 11:58 PM |
| Timezone | Mexican Pacific Standard Time |
| Lat & Lng | 27.96166° / -110.81411° |
| Postal Codes | 85300, 85310, 85319, 85320, 85330, More |
Empalme, Sonora - Map
Empalme, Sonora Population
Years 1975 to 2015| Data | 1975 | 1990 | 2000 | 2015 |
|---|---|---|---|---|
| Population | 22,895 | 33,293 | 39,895 | 46,436 |
| Population Density | 1,603 / km² | 2,331 / km² | 2,793 / km² | 3,251 / km² |
Empalme, Sonora Population change from 2000 to 2015
Increase of 16.4% from year 2000 to 2015| Location | Change since 1975 | Change since 1990 | Change since 2000 |
|---|---|---|---|
| Empalme, Sonora | +102.8% | +39.5% | +16.4% |
| Sonora | +171.3% | +68.9% | +31.3% |
| Mexico | +108.7% | +48.4% | +23.5% |
Empalme, Sonora Median Age
Median Age: 28.2 years| Location | Median Age | Median Age (Female) | Median Age (Male) |
|---|---|---|---|
| Empalme, Sonora | 28.2 years | 29 years | 27.3 years |
| Sonora | 26.7 years | 27.2 years | 26.3 years |
| Mexico | 26.2 years | 27 years | 25.3 years |
Empalme, Sonora Population Tree
Population By Age and Gender| Age | Male | Female | Total |
|---|---|---|---|
| Under 5 | 1,985 | 2,014 | 4,000 |
| 5-9 | 2,184 | 2,117 | 4,301 |
| 10-14 | 2,297 | 2,177 | 4,475 |
| 15-19 | 2,327 | 2,124 | 4,452 |
| 20-24 | 1,918 | 1,963 | 3,882 |
| 25-29 | 1,624 | 1,695 | 3,319 |
| 30-34 | 1,567 | 1,623 | 3,190 |
| 35-39 | 1,559 | 1,571 | 3,131 |
| 40-44 | 1,395 | 1,528 | 2,924 |
| 45-49 | 1,440 | 1,501 | 2,942 |
| 50-54 | 1,288 | 1,389 | 2,678 |
| 55-59 | 964 | 1,053 | 2,017 |
| 60-64 | 714 | 788 | 1,503 |
| 65-69 | 511 | 621 | 1,132 |
| 70-74 | 461 | 524 | 985 |
| 75-79 | 341 | 362 | 704 |
| 80-84 | 200 | 260 | 460 |
| 85 Plus | 147 | 204 | 352 |
Empalme, Sonora Population Density
Population Density: 3,251 / km²| Location | Population | Area | Population Density |
|---|---|---|---|
| Empalme, Sonora | 46,436 | 14.3 km² | 3,251 / km² |
| Sonora | 3.0 million | 180,608.1 km² | 16.8 / km² |
| Mexico | 126.8 million | 1,965,208 km² | 64.5 / km² |
Empalme, Sonora Historical and Projected Population
Estimated Population from 1870 to 2100Sources:
1. JRC (European Commission's Joint Research Centre) work on the GHS built-up grid
2. CIESIN (Center for International Earth Science Information Network)
3. [Link] Klein Goldewijk, K., Beusen, A., Doelman, J., and Stehfest, E.: Anthropogenic land use estimates for the Holocene – HYDE 3.2, Earth Syst. Sci. Data, 9, 927–953, https://doi.org/10.5194/essd-9-927-2017, 2017.
Neighborhoods
Business Distribution by neighborhood in Empalme, Sonora Moderna: 34.9%
Libertad: 11.7%
Colonia Infonavit Guadalupe, Moderna: 6.6%
Ortíz Rubio: 5.6%
Other: 41.2%
Business distribution by price for Empalme, Sonora
Inexpensive: 68.7%
Expensive: 16%
Moderate: 15.3%
Human Development Index (HDI)
Statistic composite index of life expectancy, education, and per capita income.Sources: [Link] Kummu, M., Taka, M. & Guillaume, J. Gridded global datasets for Gross Domestic Product and Human Development Index over 1990–2015. Sci Data 5, 180004 (2018) doi:10.1038/sdata.2018.4
Empalme, Sonora CO2 Emissions
Carbon Dioxide (CO2) Emissions Per Capita in Tonnes Per Year| Location | CO2 Emissions | CO2 Emissions Per Capita | CO2 Emissions Intensity |
|---|---|---|---|
| Empalme, Sonora | 194,778 tn | 4.19 tn | 13,639 tons/km² |
| Sonora | 12,856,808 tn | 4.24 tn | 71.2 tons/km² |
| Mexico | 496,865,013 tn | 3.92 tn | 252.8 tons/km² |
Empalme, Sonora CO2 Emissions
| 2013 CO2 emissions (tonnes/year) | 194,778 tn |
| 2013 CO2 emissions (tonnes/year) per capita | 4.19 tn |
| 2013 CO2 emissions intensity (tonnes/km²/year) | 13,639 tons/km² |
Natural Hazards Risk
Relative risk out of 10| Drought | High (10) |
| Earthquake | Medium (6) |
* Risk, particularly concerning flood or landslide, may not be for the entire area.
Sources: 1. Dilley, M., R.S. Chen, U. Deichmann, A.L. Lerner-Lam, M. Arnold, J. Agwe, P. Buys, O. Kjekstad, B. Lyon, and G. Yetman. 2005. Natural Disaster Hotspots: A Global Risk Analysis. Washington, D.C.: World Bank. https://doi.org/10.1596/0-8213-5930-4.
2. Center for Hazards and Risk Research - CHRR - Columbia University, Center for International Earth Science Information Network - CIESIN - Columbia University, and International Research Institute for Climate and Society - IRI - Columbia University. 2005. Global Drought Hazard Frequency and Distribution. Palisades, NY: NASA Socioeconomic Data and Applications Center (SEDAC). https://doi.org/10.7927/H4VX0DFT.
3. Center for Hazards and Risk Research - CHRR - Columbia University, Center for International Earth Science Information Network - CIESIN - Columbia University. 2005. Global Earthquake Hazard Distribution - Peak Ground Acceleration. Palisades, NY: NASA Socioeconomic Data and Applications Center (SEDAC). https://doi.org/10.7927/H4BZ63ZS.
Recent Nearby Earthquakes
Magnitude 3.0 and greater| Date | Time | Magnitude | Distance | Depth | Location | Link |
|---|---|---|---|---|---|---|
| 11/24/17 | 11:18 PM | 4 | 85.6 km | 10,000 m | 76km WSW of Guaymas, Mexico | usgs.gov |
| 1/17/17 | 8:09 PM | 4.1 | 80.9 km | 10,000 m | 73km SSW of Guaymas, Mexico | usgs.gov |
| 11/21/16 | 11:48 PM | 4.4 | 73.3 km | 10,000 m | 64km WSW of Guaymas, Mexico | usgs.gov |
| 9/27/16 | 10:01 PM | 4 | 64.4 km | 10,000 m | 56km WNW of Guaymas, Mexico | usgs.gov |
| 7/6/15 | 6:56 AM | 4.2 | 84.4 km | 10,000 m | 75km WSW of Guaymas, Mexico | usgs.gov |
| 8/10/14 | 11:46 AM | 5.5 | 86.3 km | 10,000 m | 76km ENE of Santa Rosalia, Mexico | usgs.gov |
| 4/3/14 | 4:41 AM | 4.2 | 85.8 km | 10,000 m | 76km WSW of Guaymas, Mexico | usgs.gov |
| 6/15/13 | 8:39 AM | 4.2 | 86.2 km | 15,000 m | Gulf of California | usgs.gov |
| 4/9/12 | 2:37 PM | 4.1 | 77.3 km | 10,000 m | Gulf of California | usgs.gov |
| 6/26/11 | 7:03 PM | 4 | 84.3 km | 20,000 m | Gulf of California | usgs.gov |
Find historical earthquake occurrences near Empalme, Sonora
Earliest Date Latest Date
Magnitude 3.0 and greater Magnitude 4.0 and greater Magnitude 5.0 and greater
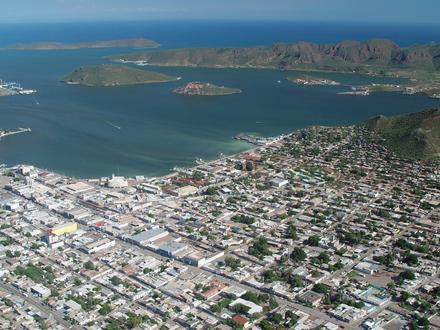
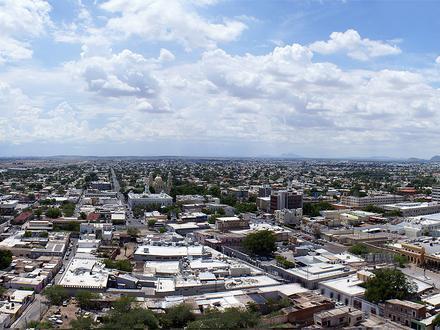
Empalme, Sonora
Empalme is a city surrounded by a municipality located on the south-central coast of the Mexican state of Sonora. According to the 2005 census the population of the city was 40,630 inhabitants, while the municipality, which has an area of 708.53 km² .. Empalme, Sonora Wikipedia Page
Postal Codes
Percentage of businesses by Postal Codes in Empalme, Sonora Postal Code 85330: 52.1%
Postal Code 85370: 12.4%
Postal Code 85350: 5.6%
Other: 29.9%
About Our Data
The data on this page is estimated using a number of publicly available tools and resources. It is provided without warranty, and could contain inaccuracies. Use at your own risk. See here for more information.