Businesses in Xochimilco
Hotels & Travel
Restaurants
Automotive
Financial Services
Medical
Beauty & Spas
Community & Government
Industries
Business Distribution by Industry Shopping: 23.7%
Restaurants: 16.6%
Food: 13.2%
Medical: 5.9%
Industry: 5.2%
Other: 35.4%
| Industry Description | Number of Establishments | Average Google Rating | Businesses per 1,000 residents |
|---|---|---|---|
| Car repair | 57 | 3.9 | 0.1 |
| Beauty salons | 58 | 3.6 | 0.1 |
| Hairdressers | 48 | 3.7 | 0.1 |
| Manicures and pedicures | 48 | 3.6 | 0.1 |
| Public administration | 50 | 3.8 | 0.1 |
| Higher education (colleges and universities) | 48 | 4.5 | 0.1 |
| Secondary education | 46 | 4.2 | 0.1 |
| Creative arts | 50 | 4.2 | 0.1 |
| Bakeries | 44 | 3.8 | 0.1 |
| Convenience stores | 38 | 3.9 | 0.1 |
| Construction of houses | 81 | 3.5 | 0.2 |
| Real estate | 113 | 4.0 | 0.3 |
| Construction of buildings | 52 | 3.9 | 0.1 |
| Dentists | 47 | 4.8 | 0.1 |
| Health and medical | 62 | 4.2 | 0.1 |
| Hearing | 48 | 0.1 | |
| Hospitals | 81 | 4.2 | 0.2 |
| Bars, pubs and taverns | 104 | 4.3 | 0.2 |
| Cafes | 47 | 4.2 | 0.1 |
| Fast food restaurants | 92 | 4.4 | 0.2 |
| Mexican restaurants | 307 | 4.2 | 0.7 |
| Hardware stores | 39 | 3.9 | 0.1 |
| Nurseries and garden supplies | 41 | 4.4 | 0.1 |
| Office supplies and stationery stores | 92 | 4.0 | 0.2 |
| Shopping other | 47 | 3.9 | 0.1 |
| Fitness centers | 41 | 4.2 | 0.1 |
| Stadiums and arenas | 37 | 0.1 |
| Area of Xochimilco, Mexico City | 63.3 km² |
| Population | 429,659 |
| Male Population | 211,638 (49.3%) |
| Female Population | 218,022 (50.7%) |
| Population change from 1975 to 2015 | +46.5% |
| Population change from 2000 to 2015 | +3.2% |
| Median Age | 29.4 |
| Male Median Age | 28.4 |
| Female Median Age | 30.3 |
| Area Codes | 525 |
| Neighborhoods | Parque Ecológico de Xochimilco, San Lorenzo la Cebada, San Mateo Xalpa, Santa María Tepepan, Xaltocan, Xochimilco |
| Local Time | Saturday 11:37 PM |
| Timezone | Central Daylight Time |
| Lat & Lng | 19.25785° / -99.10513° |
| Postal Codes | 01029, 10290, 13063, 13559, 14654, More |
Xochimilco, Mexico City - Map
Xochimilco, Mexico City Population
Years 1975 to 2015| Data | 1975 | 1990 | 2000 | 2015 |
|---|---|---|---|---|
| Population | 293,205 | 377,376 | 416,297 | 429,659 |
| Population Density | 4,631 / km² | 5,960 / km² | 6,575 / km² | 6,786 / km² |
Xochimilco Population change from 2000 to 2015
Increase of 3.2% from year 2000 to 2015| Location | Change since 1975 | Change since 1990 | Change since 2000 |
|---|---|---|---|
| Xochimilco, Mexico City | +46.5% | +13.9% | +3.2% |
| Mexico City | +29.1% | +6% | -0.8% |
| Ciudad de México | +31.2% | +7.2% | -0.1% |
| Mexico | +108.7% | +48.4% | +23.5% |
Xochimilco, Mexico City Median Age
Median Age: 29.4 years| Location | Median Age | Median Age (Female) | Median Age (Male) |
|---|---|---|---|
| Xochimilco, Mexico City | 29.4 years | 30.3 years | 28.4 years |
| Mexico City | 31.6 years | 32.9 years | 30.2 years |
| Ciudad de México | 31.4 years | 32.7 years | 30 years |
| Mexico | 26.2 years | 27 years | 25.3 years |
Xochimilco, Mexico City Population Tree
Population By Age and Gender| Age | Male | Female | Total |
|---|---|---|---|
| Under 5 | 17,067 | 16,113 | 33,180 |
| 5-9 | 18,207 | 17,710 | 35,917 |
| 10-14 | 18,126 | 17,592 | 35,719 |
| 15-19 | 19,651 | 18,861 | 38,512 |
| 20-24 | 20,235 | 19,476 | 39,711 |
| 25-29 | 18,647 | 18,165 | 36,812 |
| 30-34 | 17,703 | 17,842 | 35,546 |
| 35-39 | 17,151 | 17,978 | 35,129 |
| 40-44 | 14,996 | 16,211 | 31,207 |
| 45-49 | 12,637 | 13,841 | 26,479 |
| 50-54 | 11,105 | 12,439 | 23,545 |
| 55-59 | 8,262 | 9,346 | 17,608 |
| 60-64 | 6,363 | 7,387 | 13,750 |
| 65-69 | 4,435 | 5,038 | 9,473 |
| 70-74 | 3,069 | 3,862 | 6,932 |
| 75-79 | 1,966 | 2,591 | 4,557 |
| 80-84 | 1,097 | 1,874 | 2,972 |
| 85 Plus | 921 | 1,697 | 2,618 |
Xochimilco, Mexico City Population Density
Population Density: 6,786 / km²| Location | Population | Area | Population Density |
|---|---|---|---|
| Xochimilco, Mexico City | 429,659 | 63.3 km² | 6,786 / km² |
| Mexico City | 8.9 million | 732.2 km² | 12,161 / km² |
| Ciudad de México | 9.2 million | 1,494.6 km² | 6,179 / km² |
| Mexico | 126.8 million | 1,965,208 km² | 64.5 / km² |
Xochimilco, Mexico City Projected Population
Estimated Population from 1975 to 2100Sources:
1. JRC (European Commission's Joint Research Centre) work on the GHS built-up grid
2. CIESIN (Center for International Earth Science Information Network)
3. [Link] Klein Goldewijk, K., Beusen, A., Doelman, J., and Stehfest, E.: Anthropogenic land use estimates for the Holocene – HYDE 3.2, Earth Syst. Sci. Data, 9, 927–953, https://doi.org/10.5194/essd-9-927-2017, 2017.
Business distribution by price for Xochimilco, Mexico City
Inexpensive: 72.2%
Moderate: 15.7%
Expensive: 11.8%
Very Expensive: 0.3%
Human Development Index (HDI)
Statistic composite index of life expectancy, education, and per capita income.Sources: [Link] Kummu, M., Taka, M. & Guillaume, J. Gridded global datasets for Gross Domestic Product and Human Development Index over 1990–2015. Sci Data 5, 180004 (2018) doi:10.1038/sdata.2018.4
Xochimilco, Mexico City CO2 Emissions
Carbon Dioxide (CO2) Emissions Per Capita in Tonnes Per Year| Location | CO2 Emissions | CO2 Emissions Per Capita | CO2 Emissions Intensity |
|---|---|---|---|
| Xochimilco, Mexico City | 2,179,539 tn | 5.07 tn | 34,425 tons/km² |
| Mexico City | 44,998,547 tn | 5.05 tn | 61,456 tons/km² |
| Ciudad de México | 45,602,268 tn | 4.94 tn | 30,511 tons/km² |
| Mexico | 496,865,013 tn | 3.92 tn | 252.8 tons/km² |
Xochimilco, Mexico City CO2 Emissions
| 2013 CO2 emissions (tonnes/year) | 2,179,539 tn |
| 2013 CO2 emissions (tonnes/year) per capita | 5.07 tn |
| 2013 CO2 emissions intensity (tonnes/km²/year) | 34,425 tons/km² |
Natural Hazards Risk
Relative risk out of 10| Landslide | High (7) |
| Drought | Medium (4) |
| Flood | High (8) |
| Earthquake | Medium (4) |
* Risk, particularly concerning flood or landslide, may not be for the entire area.
Sources: 1. Dilley, M., R.S. Chen, U. Deichmann, A.L. Lerner-Lam, M. Arnold, J. Agwe, P. Buys, O. Kjekstad, B. Lyon, and G. Yetman. 2005. Natural Disaster Hotspots: A Global Risk Analysis. Washington, D.C.: World Bank. https://doi.org/10.1596/0-8213-5930-4.
2. Center for Hazards and Risk Research - CHRR - Columbia University, Center for International Earth Science Information Network - CIESIN - Columbia University, and Norwegian Geotechnical Institute - NGI. 2005. Global Landslide Hazard Distribution. Palisades, NY: NASA Socioeconomic Data and Applications Center (SEDAC). https://doi.org/10.7927/H4P848VZ.
3. Center for Hazards and Risk Research - CHRR - Columbia University, Center for International Earth Science Information Network - CIESIN - Columbia University, and International Research Institute for Climate and Society - IRI - Columbia University. 2005. Global Drought Hazard Frequency and Distribution. Palisades, NY: NASA Socioeconomic Data and Applications Center (SEDAC). https://doi.org/10.7927/H4VX0DFT.
4. Center for Hazards and Risk Research - CHRR - Columbia University, Center for International Earth Science Information Network - CIESIN - Columbia University. 2005. Global Earthquake Hazard Distribution - Peak Ground Acceleration. Palisades, NY: NASA Socioeconomic Data and Applications Center (SEDAC). https://doi.org/10.7927/H4BZ63ZS.
5. Center for Hazards and Risk Research - CHRR - Columbia University, Center for International Earth Science Information Network - CIESIN - Columbia University. 2005. Global Flood Hazard Frequency and Distribution. Palisades, NY: NASA Socioeconomic Data and Applications Center (SEDAC). https://doi.org/10.7927/H4668B3D.
Recent Nearby Earthquakes
Magnitude 3.0 and greater| Date | Time | Magnitude | Distance | Depth | Location | Link |
|---|---|---|---|---|---|---|
| 7/16/19 | 8:59 PM | 3.1 | 19.3 km | 10,000 m | 2km NW of Ciudad Nezahualcoyotl, Mexico | usgs.gov |
| 5/30/07 | 1:42 PM | 4 | 17.7 km | 14,900 m | Distrito Federal, Mexico | usgs.gov |
| 1/25/07 | 6:38 AM | 3.7 | 11.1 km | 32,100 m | Distrito Federal, Mexico | usgs.gov |
| 5/5/06 | 8:24 AM | 3.5 | 18.7 km | 1,000 m | Distrito Federal, Mexico | usgs.gov |
| 2/28/06 | 3:58 PM | 3.4 | 13.2 km | 2,000 m | Distrito Federal, Mexico | usgs.gov |
| 10/16/05 | 7:35 AM | 3.2 | 10.3 km | 16,600 m | Distrito Federal, Mexico | usgs.gov |
| 10/16/05 | 7:12 AM | 3.6 | 11 km | 13,000 m | Distrito Federal, Mexico | usgs.gov |
| 6/22/05 | 9:01 PM | 3.7 | 26.6 km | 1,400 m | Estado de Mexico, Mexico | usgs.gov |
| 6/21/05 | 4:24 AM | 3.5 | 31.7 km | 1,300 m | Estado de Mexico, Mexico | usgs.gov |
| 5/12/05 | 1:06 AM | 3.4 | 28.8 km | 15,000 m | Estado de Mexico, Mexico | usgs.gov |
Find historical earthquake occurrences near Xochimilco, Mexico City
Earliest Date Latest Date
Magnitude 3.0 and greater Magnitude 4.0 and greater Magnitude 5.0 and greater

Xochimilco, Mexico City
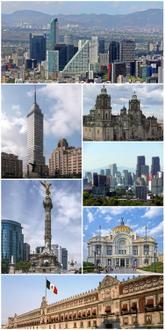
Xochimilco (Spanish pronunciation: [sotʃiˈmilko]) is one of the 16 delegaciones or boroughs within Mexican Federal District. The borough is centered on the formerly independent city of Xochimilco, which was established on what was the southern shore .. Xochimilco Wikipedia Page
Postal Codes
Percentage of businesses by Postal Codes in Xochimilco Postal Code 16090: 12.5%
Postal Code 16020: 8.6%
Postal Code 16050: 7%
Postal Code 16070: 6.8%
Postal Code 16010: 6.2%
Postal Code 16030: 5.3%
Postal Code 16035: 5.1%
Other: 48.5%

About Our Data
The data on this page is estimated using a number of publicly available tools and resources. It is provided without warranty, and could contain inaccuracies. Use at your own risk. See here for more information.