- World
- »
- MX
- »
- Sonora
- »
- Yavaros, Sonora
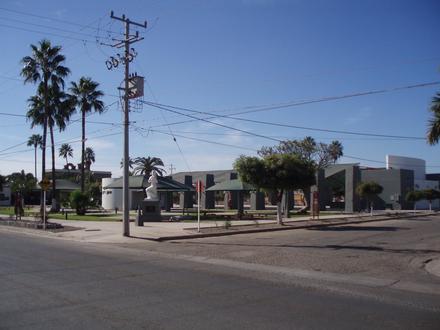
Businesses in Yavaros
| Area of Yavaros, Sonora | 2.101 km² |
| Population | 4,036 |
| Male Population | 2,073 (51.4%) |
| Female Population | 1,963 (48.6%) |
| Population change from 1975 to 2015 | +96.1% |
| Population change from 2000 to 2015 | +15.1% |
| Median Age | 27.1 |
| Male Median Age | 27.3 |
| Female Median Age | 26.9 |
| Area Codes | 346 |
| Local Time | Friday 11:58 PM |
| Timezone | Mexican Pacific Standard Time |
| Lat & Lng | 26.70483° / -109.52103° |
Yavaros, Sonora - Map
Yavaros, Sonora Population
Years 1975 to 2015| Data | 1975 | 1990 | 2000 | 2015 |
|---|---|---|---|---|
| Population | 2,058 | 2,954 | 3,506 | 4,036 |
| Population Density | 979.7 / km² | 1,406 / km² | 1,669 / km² | 1,921 / km² |
Yavaros Population change from 2000 to 2015
Increase of 15.1% from year 2000 to 2015| Location | Change since 1975 | Change since 1990 | Change since 2000 |
|---|---|---|---|
| Yavaros, Sonora | +96.1% | +36.6% | +15.1% |
| Sonora | +171.3% | +68.9% | +31.3% |
| Mexico | +108.7% | +48.4% | +23.5% |
Yavaros, Sonora Median Age
Median Age: 27.1 years| Location | Median Age | Median Age (Female) | Median Age (Male) |
|---|---|---|---|
| Yavaros, Sonora | 27.1 years | 26.9 years | 27.3 years |
| Sonora | 26.7 years | 27.2 years | 26.3 years |
| Mexico | 26.2 years | 27 years | 25.3 years |
Yavaros, Sonora Population Tree
Population By Age and Gender| Age | Male | Female | Total |
|---|---|---|---|
| Under 5 | 163 | 175 | 339 |
| 5-9 | 220 | 171 | 392 |
| 10-14 | 203 | 204 | 407 |
| 15-19 | 194 | 214 | 408 |
| 20-24 | 189 | 173 | 363 |
| 25-29 | 142 | 118 | 261 |
| 30-34 | 150 | 135 | 285 |
| 35-39 | 150 | 142 | 293 |
| 40-44 | 138 | 126 | 265 |
| 45-49 | 130 | 112 | 243 |
| 50-54 | 99 | 90 | 189 |
| 55-59 | 111 | 102 | 213 |
| 60-64 | 55 | 65 | 120 |
| 65-69 | 43 | 37 | 81 |
| 70-74 | 36 | 49 | 86 |
| 75-79 | 22 | 20 | 42 |
| 80-84 | 14 | 14 | 29 |
| 85 Plus | 13 | 15 | 29 |
Yavaros, Sonora Population Density
Population Density: 1,921 / km²| Location | Population | Area | Population Density |
|---|---|---|---|
| Yavaros, Sonora | 4,036 | 2.101 km² | 1,921 / km² |
| Sonora | 3.0 million | 180,608.1 km² | 16.8 / km² |
| Mexico | 126.8 million | 1,965,208 km² | 64.5 / km² |
Yavaros, Sonora Historical and Projected Population
Estimated Population from 1780 to 2100Sources:
1. JRC (European Commission's Joint Research Centre) work on the GHS built-up grid
2. CIESIN (Center for International Earth Science Information Network)
3. [Link] Klein Goldewijk, K., Beusen, A., Doelman, J., and Stehfest, E.: Anthropogenic land use estimates for the Holocene – HYDE 3.2, Earth Syst. Sci. Data, 9, 927–953, https://doi.org/10.5194/essd-9-927-2017, 2017.
Human Development Index (HDI)
Statistic composite index of life expectancy, education, and per capita income.Sources: [Link] Kummu, M., Taka, M. & Guillaume, J. Gridded global datasets for Gross Domestic Product and Human Development Index over 1990–2015. Sci Data 5, 180004 (2018) doi:10.1038/sdata.2018.4
Natural Hazards Risk
Relative risk out of 10| Drought | High (10) |
| Earthquake | Medium (5.8) |
* Risk, particularly concerning flood or landslide, may not be for the entire area.
Sources: 1. Dilley, M., R.S. Chen, U. Deichmann, A.L. Lerner-Lam, M. Arnold, J. Agwe, P. Buys, O. Kjekstad, B. Lyon, and G. Yetman. 2005. Natural Disaster Hotspots: A Global Risk Analysis. Washington, D.C.: World Bank. https://doi.org/10.1596/0-8213-5930-4.
2. Center for Hazards and Risk Research - CHRR - Columbia University, Center for International Earth Science Information Network - CIESIN - Columbia University. 2005. Global Earthquake Hazard Distribution - Peak Ground Acceleration. Palisades, NY: NASA Socioeconomic Data and Applications Center (SEDAC). https://doi.org/10.7927/H4BZ63ZS.
3. Center for Hazards and Risk Research - CHRR - Columbia University, Center for International Earth Science Information Network - CIESIN - Columbia University, and International Research Institute for Climate and Society - IRI - Columbia University. 2005. Global Drought Hazard Frequency and Distribution. Palisades, NY: NASA Socioeconomic Data and Applications Center (SEDAC). https://doi.org/10.7927/H4VX0DFT.
Recent Nearby Earthquakes
Magnitude 3.0 and greater| Date | Time | Magnitude | Distance | Depth | Location | Link |
|---|---|---|---|---|---|---|
| 10/19/13 | 4:32 PM | 4.1 | 93.4 km | 10,140 m | 84km SW of Etchoropo, Mexico | usgs.gov |
| 3/22/04 | 12:57 AM | 4 | 92.2 km | 10,000 m | Gulf of California | usgs.gov |
| 3/12/03 | 3:46 PM | 4.8 | 94.7 km | 10,000 m | Gulf of California | usgs.gov |
| 12/8/02 | 9:45 AM | 3.6 | 91.7 km | 10,000 m | Gulf of California | usgs.gov |
| 10/28/02 | 10:16 PM | 4.2 | 86.2 km | 10,000 m | Sonora-Sinaloa border region, Mexico | usgs.gov |
| 8/7/01 | 9:38 PM | 4.6 | 97.8 km | 10,000 m | Gulf of California | usgs.gov |
| 9/22/99 | 3:20 PM | 4.3 | 54.8 km | 10,000 m | Gulf of California | usgs.gov |
| 7/5/99 | 10:07 AM | 4.1 | 95.3 km | 10,000 m | Gulf of California | usgs.gov |
| 5/29/98 | 7:42 AM | 3.4 | 89 km | 10,000 m | Sinaloa, Mexico | usgs.gov |
| 6/1/93 | 7:08 PM | 4.7 | 96.2 km | 10,000 m | Gulf of California | usgs.gov |
Find historical earthquake occurrences near Yavaros, Sonora
Earliest Date Latest Date
Magnitude 3.0 and greater Magnitude 4.0 and greater Magnitude 5.0 and greater
Yavaros, Sonora
Yavaros is a fishing ports of Sonora state in Mexico and is one of six ports within the state. The population of Yavaros is 4,058. It is located within Huatabampo Municipality. Yavaros Wikipedia Page

About Our Data
The data on this page is estimated using a number of publicly available tools and resources. It is provided without warranty, and could contain inaccuracies. Use at your own risk. See here for more information.