Businesses in Grootfontein
Hotels & Travel
Restaurants
Automotive
Financial Services
Medical
Beauty & Spas
Community & Government
Industries
Business Distribution by Industry Shopping: 16.9%
Hotels & Travel: 13.3%
Entertainment: 10.4%
Industry: 8.3%
Automotive: 8.1%
Restaurants: 6%
Food: 5.2%
Other: 31.7%
| Area of Grootfontein, Otjozondjupa Region | 27.9 km² |
| Population | 18,175 |
| Male Population | 9,313 (51.2%) |
| Female Population | 8,862 (48.8%) |
| Population change from 1975 to 2015 | +114.1% |
| Population change from 2000 to 2015 | +12.7% |
| Median Age | 22.8 |
| Male Median Age | 23.5 |
| Female Median Age | 22.1 |
| Area Codes | 62, 67 |
| Local Time | Friday 5:01 AM |
| Timezone | Central Africa Time |
| Lat & Lng | -19.56667° / 18.11667° |
Grootfontein, Otjozondjupa Region - Map
Grootfontein, Otjozondjupa Region Population
Years 1975 to 2015| Data | 1975 | 1990 | 2000 | 2015 |
|---|---|---|---|---|
| Population | 8,491 | 12,742 | 16,122 | 18,175 |
| Population Density | 304.6 / km² | 457.2 / km² | 578.4 / km² | 652.1 / km² |
Grootfontein Population change from 2000 to 2015
Increase of 12.7% from year 2000 to 2015| Location | Change since 1975 | Change since 1990 | Change since 2000 |
|---|---|---|---|
| Grootfontein, Otjozondjupa Region | +114.1% | +42.6% | +12.7% |
| Otjozondjupa | +50% | +31.7% | +13.5% |
| Namibia | +169.8% | +71.5% | +28.5% |
Grootfontein, Otjozondjupa Region Median Age
Median Age: 22.8 years| Location | Median Age | Median Age (Female) | Median Age (Male) |
|---|---|---|---|
| Grootfontein, Otjozondjupa Region | 22.8 years | 22.1 years | 23.5 years |
| Otjozondjupa | 22.1 years | 21.6 years | 22.6 years |
| Namibia | 21.2 years | 21.7 years | 20.6 years |
Grootfontein, Otjozondjupa Region Population Tree
Population By Age and Gender| Age | Male | Female | Total |
|---|---|---|---|
| Under 5 | 1,312 | 1,240 | 2,552 |
| 5-9 | 987 | 976 | 1,964 |
| 10-14 | 866 | 943 | 1,810 |
| 15-19 | 804 | 880 | 1,684 |
| 20-24 | 972 | 946 | 1,919 |
| 25-29 | 919 | 847 | 1,766 |
| 30-34 | 807 | 706 | 1,513 |
| 35-39 | 629 | 599 | 1,229 |
| 40-44 | 480 | 432 | 912 |
| 45-49 | 465 | 390 | 856 |
| 50-54 | 402 | 290 | 692 |
| 55-59 | 277 | 205 | 482 |
| 60-64 | 170 | 123 | 293 |
| 65-69 | 67 | 91 | 159 |
| 70-74 | 68 | 64 | 133 |
| 75-79 | 38 | 53 | 91 |
| 80-84 | 24 | 35 | 60 |
| 85 Plus | 26 | 42 | 69 |
Grootfontein, Otjozondjupa Region Population Density
Population Density: 652.1 / km²| Location | Population | Area | Population Density |
|---|---|---|---|
| Grootfontein, Otjozondjupa Region | 18,175 | 27.9 km² | 652.1 / km² |
| Otjozondjupa | 163,008 | 104,689.2 km² | 1.56 / km² |
| Namibia | 2.5 million | 824,094.1 km² | 3.02 / km² |
Grootfontein, Otjozondjupa Region Historical and Projected Population
Estimated Population from 1780 to 2100Sources:
1. JRC (European Commission's Joint Research Centre) work on the GHS built-up grid
2. CIESIN (Center for International Earth Science Information Network)
3. [Link] Klein Goldewijk, K., Beusen, A., Doelman, J., and Stehfest, E.: Anthropogenic land use estimates for the Holocene – HYDE 3.2, Earth Syst. Sci. Data, 9, 927–953, https://doi.org/10.5194/essd-9-927-2017, 2017.
Area Codes
Percentage Area Codes used by businesses in Grootfontein Area Code 67: 76.2%
Area Code 81: 19%
Area Code 61: 4.8%
Human Development Index (HDI)
Statistic composite index of life expectancy, education, and per capita income.Sources: [Link] Kummu, M., Taka, M. & Guillaume, J. Gridded global datasets for Gross Domestic Product and Human Development Index over 1990–2015. Sci Data 5, 180004 (2018) doi:10.1038/sdata.2018.4
Grootfontein, Otjozondjupa Region CO2 Emissions
Carbon Dioxide (CO2) Emissions Per Capita in Tonnes Per Year| Location | CO2 Emissions | CO2 Emissions Per Capita | CO2 Emissions Intensity |
|---|---|---|---|
| Grootfontein, Otjozondjupa Region | 62,789 tn | 3.45 tn | 2,252 tons/km² |
| Otjozondjupa | 463,206 tn | 2.84 tn | 4.42 tons/km² |
| Namibia | 7,056,181 tn | 2.84 tn | 8.56 tons/km² |
Grootfontein, Otjozondjupa Region CO2 Emissions
| 2013 CO2 emissions (tonnes/year) | 62,789 tn |
| 2013 CO2 emissions (tonnes/year) per capita | 3.45 tn |
| 2013 CO2 emissions intensity (tonnes/km²/year) | 2,252 tons/km² |
Natural Hazards Risk
Relative risk out of 10| Drought | High (8) |
* Risk, particularly concerning flood or landslide, may not be for the entire area.
Sources: 1. Dilley, M., R.S. Chen, U. Deichmann, A.L. Lerner-Lam, M. Arnold, J. Agwe, P. Buys, O. Kjekstad, B. Lyon, and G. Yetman. 2005. Natural Disaster Hotspots: A Global Risk Analysis. Washington, D.C.: World Bank. https://doi.org/10.1596/0-8213-5930-4.
2. Center for Hazards and Risk Research - CHRR - Columbia University, Center for International Earth Science Information Network - CIESIN - Columbia University, and International Research Institute for Climate and Society - IRI - Columbia University. 2005. Global Drought Hazard Frequency and Distribution. Palisades, NY: NASA Socioeconomic Data and Applications Center (SEDAC). https://doi.org/10.7927/H4VX0DFT.

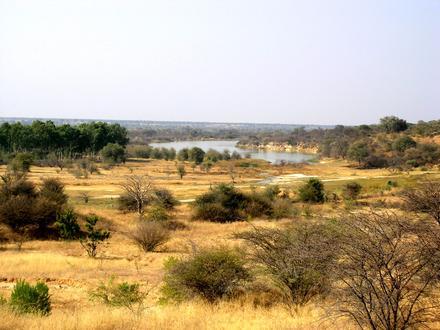
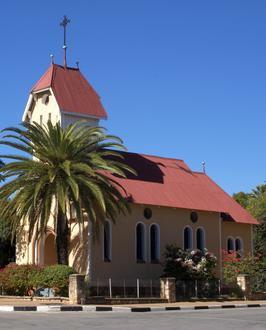
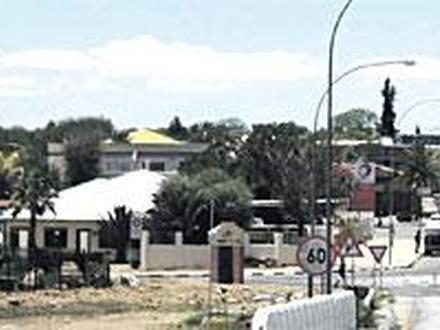
Grootfontein, Otjozondjupa Region
Grootfontein (Afrikaans: Large Spring after the nearby hot springs) is a city of 23,793 inhabitants in the Otjozondjupa Region of central Namibia. It is one of the three towns in the Otavi Triangle, situated on the B8 national road that leads from Ot.. Grootfontein Wikipedia Page

About Our Data
The data on this page is estimated using a number of publicly available tools and resources. It is provided without warranty, and could contain inaccuracies. Use at your own risk. See here for more information.