Businesses in Opuwo
Industries
Business Distribution by Industry Hotels & Travel: 23.2%
Shopping: 18.2%
Food: 7.7%
Education: 7.2%
Restaurants: 6.6%
Automotive: 6.1%
Community & Government: 6.1%
Home Services: 5%
Other: 19.9%
| Area of Opuwo, Kunene Region | 1.998 km² |
| Population | 3,990 |
| Male Population | 2,036 (51%) |
| Female Population | 1,954 (49%) |
| Population change from 1975 to 2015 | +158.4% |
| Population change from 2000 to 2015 | +21.6% |
| Median Age | 22.6 |
| Male Median Age | 22 |
| Female Median Age | 23.3 |
| Area Codes | 65 |
| Local Time | Friday 4:02 AM |
| Timezone | Central Africa Time |
| Lat & Lng | -18.06068° / 13.83998° |
Opuwo, Kunene Region - Map
Opuwo, Kunene Region Population
Years 1975 to 2015| Data | 1975 | 1990 | 2000 | 2015 |
|---|---|---|---|---|
| Population | 1,544 | 2,475 | 3,282 | 3,990 |
| Population Density | 772.9 / km² | 1,238 / km² | 1,642 / km² | 1,997 / km² |
Opuwo Population change from 2000 to 2015
Increase of 21.6% from year 2000 to 2015| Location | Change since 1975 | Change since 1990 | Change since 2000 |
|---|---|---|---|
| Opuwo, Kunene Region | +158.4% | +61.2% | +21.6% |
| Kunene | +303.2% | +117.2% | +46.3% |
| Namibia | +169.8% | +71.5% | +28.5% |
Opuwo, Kunene Region Median Age
Median Age: 22.6 years| Location | Median Age | Median Age (Female) | Median Age (Male) |
|---|---|---|---|
| Opuwo, Kunene Region | 22.6 years | 23.3 years | 22 years |
| Kunene | 19.9 years | 20 years | 19.8 years |
| Namibia | 21.2 years | 21.7 years | 20.6 years |
Opuwo, Kunene Region Population Tree
Population By Age and Gender| Age | Male | Female | Total |
|---|---|---|---|
| Under 5 | 268 | 271 | 539 |
| 5-9 | 260 | 227 | 488 |
| 10-14 | 216 | 206 | 422 |
| 15-19 | 204 | 171 | 375 |
| 20-24 | 175 | 155 | 330 |
| 25-29 | 139 | 129 | 268 |
| 30-34 | 138 | 122 | 261 |
| 35-39 | 131 | 117 | 248 |
| 40-44 | 107 | 104 | 211 |
| 45-49 | 92 | 93 | 186 |
| 50-54 | 79 | 90 | 170 |
| 55-59 | 70 | 82 | 152 |
| 60-64 | 57 | 59 | 116 |
| 65-69 | 37 | 48 | 85 |
| 70-74 | 27 | 32 | 60 |
| 75-79 | 18 | 19 | 38 |
| 80-84 | 9 | 13 | 22 |
| 85 Plus | 9 | 15 | 25 |
Opuwo, Kunene Region Population Density
Population Density: 1,997 / km²| Location | Population | Area | Population Density |
|---|---|---|---|
| Opuwo, Kunene Region | 3,990 | 1.998 km² | 1,997 / km² |
| Kunene | 106,962 | 115,143.7 km² | 0.93 / km² |
| Namibia | 2.5 million | 824,094.1 km² | 3.02 / km² |
Opuwo, Kunene Region Historical and Projected Population
Estimated Population from 1850 to 2100Sources:
1. JRC (European Commission's Joint Research Centre) work on the GHS built-up grid
2. CIESIN (Center for International Earth Science Information Network)
3. [Link] Klein Goldewijk, K., Beusen, A., Doelman, J., and Stehfest, E.: Anthropogenic land use estimates for the Holocene – HYDE 3.2, Earth Syst. Sci. Data, 9, 927–953, https://doi.org/10.5194/essd-9-927-2017, 2017.
Human Development Index (HDI)
Statistic composite index of life expectancy, education, and per capita income.Sources: [Link] Kummu, M., Taka, M. & Guillaume, J. Gridded global datasets for Gross Domestic Product and Human Development Index over 1990–2015. Sci Data 5, 180004 (2018) doi:10.1038/sdata.2018.4
Opuwo, Kunene Region CO2 Emissions
Carbon Dioxide (CO2) Emissions Per Capita in Tonnes Per Year| Location | CO2 Emissions | CO2 Emissions Per Capita | CO2 Emissions Intensity |
|---|---|---|---|
| Opuwo, Kunene Region | 10,487 tn | 2.63 tn | 5,249 tons/km² |
| Kunene | 263,462 tn | 2.46 tn | 2.29 tons/km² |
| Namibia | 7,056,181 tn | 2.84 tn | 8.56 tons/km² |
Opuwo, Kunene Region CO2 Emissions
| 2013 CO2 emissions (tonnes/year) | 10,487 tn |
| 2013 CO2 emissions (tonnes/year) per capita | 2.63 tn |
| 2013 CO2 emissions intensity (tonnes/km²/year) | 5,249 tons/km² |
Natural Hazards Risk
Relative risk out of 10| Drought | High (9) |
* Risk, particularly concerning flood or landslide, may not be for the entire area.
Sources: 1. Dilley, M., R.S. Chen, U. Deichmann, A.L. Lerner-Lam, M. Arnold, J. Agwe, P. Buys, O. Kjekstad, B. Lyon, and G. Yetman. 2005. Natural Disaster Hotspots: A Global Risk Analysis. Washington, D.C.: World Bank. https://doi.org/10.1596/0-8213-5930-4.
2. Center for Hazards and Risk Research - CHRR - Columbia University, Center for International Earth Science Information Network - CIESIN - Columbia University, and International Research Institute for Climate and Society - IRI - Columbia University. 2005. Global Drought Hazard Frequency and Distribution. Palisades, NY: NASA Socioeconomic Data and Applications Center (SEDAC). https://doi.org/10.7927/H4VX0DFT.
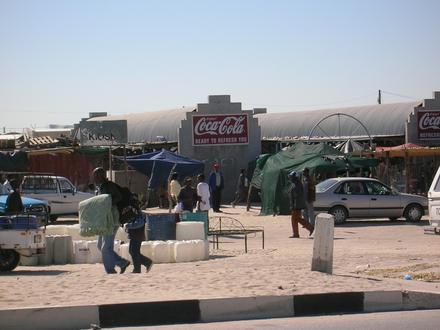
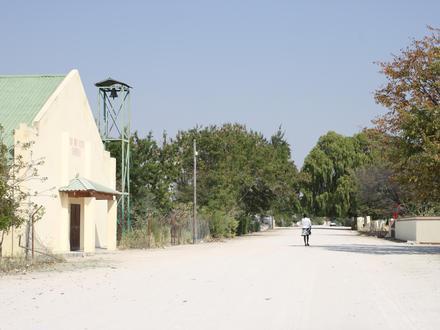
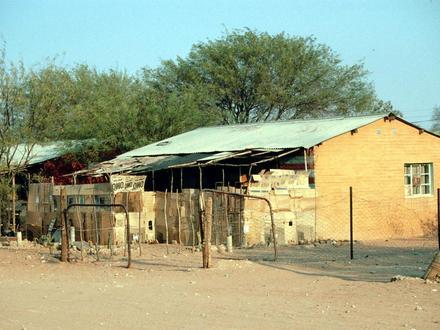
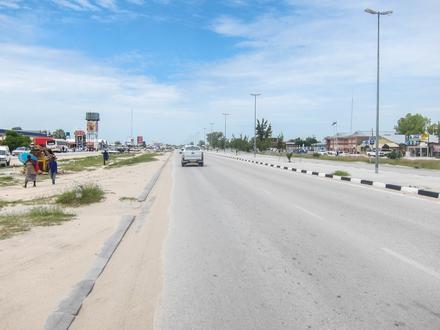
Opuwo, Kunene Region
Opuwo is the capital of the Kunene Region in north-western Namibia. The town is situated about 720 km north-northwest from the capital Windhoek, and has a population of 15,000. Pieter de Villiers of the Congress of Democrats is the town's mayor. Opuwo Wikipedia Page
About Our Data
The data on this page is estimated using a number of publicly available tools and resources. It is provided without warranty, and could contain inaccuracies. Use at your own risk. See here for more information.