Businesses in Alteveer, Groningen
| Area of Alteveer, Groningen | 0.547 km² |
| Population | 632 |
| Male Population | 313 (49.5%) |
| Female Population | 319 (50.5%) |
| Population change from 1975 to 2015 | -4.5% |
| Population change from 2000 to 2015 | -1.9% |
| Median Age | 44.5 |
| Male Median Age | 43.2 |
| Female Median Age | 45.7 |
| Area Codes | 528 |
| Local Time | Friday 6:11 PM |
| Timezone | Central European Summer Time |
| Lat & Lng | 53.05083° / 6.99444° |
| Postal Codes | 9661 |
Alteveer, Groningen - Map
Alteveer, Groningen Population
Years 1975 to 2015| Data | 1975 | 1990 | 2000 | 2015 |
|---|---|---|---|---|
| Population | 662 | 693 | 644 | 632 |
| Population Density | 1,210 / km² | 1,266 / km² | 1,177 / km² | 1,155 / km² |
Alteveer, Groningen Population change from 2000 to 2015
Decrease of 1.9% from year 2000 to 2015| Location | Change since 1975 | Change since 1990 | Change since 2000 |
|---|---|---|---|
| Alteveer, Groningen | -4.5% | -8.8% | -1.9% |
| Groningen | +15.2% | +8% | +3.3% |
| Netherlands | +24.3% | +13.4% | +6.5% |
Alteveer, Groningen Median Age
Median Age: 44.5 years| Location | Median Age | Median Age (Female) | Median Age (Male) |
|---|---|---|---|
| Alteveer, Groningen | 44.5 years | 45.7 years | 43.2 years |
| Groningen | 40.6 years | 41.5 years | 39.6 years |
| Netherlands | 41 years | 41.7 years | 40.2 years |
Alteveer, Groningen Population Tree
Population By Age and Gender| Age | Male | Female | Total |
|---|---|---|---|
| Under 5 | 15 | 15 | 31 |
| 5-9 | 19 | 17 | 36 |
| 10-14 | 20 | 18 | 39 |
| 15-19 | 18 | 18 | 37 |
| 20-24 | 17 | 15 | 32 |
| 25-29 | 16 | 15 | 31 |
| 30-34 | 16 | 16 | 32 |
| 35-39 | 19 | 20 | 40 |
| 40-44 | 25 | 23 | 48 |
| 45-49 | 24 | 24 | 49 |
| 50-54 | 23 | 23 | 47 |
| 55-59 | 21 | 21 | 42 |
| 60-64 | 23 | 24 | 48 |
| 65-69 | 18 | 19 | 38 |
| 70-74 | 15 | 17 | 32 |
| 75-79 | 11 | 14 | 26 |
| 80-84 | 7 | 11 | 18 |
| 85 Plus | 4 | 10 | 15 |
Alteveer, Groningen Population Density
Population Density: 1,155 / km²| Location | Population | Area | Population Density |
|---|---|---|---|
| Alteveer, Groningen | 632 | 0.547 km² | 1,155 / km² |
| Groningen | 575,724 | 2,812.3 km² | 204.7 / km² |
| Netherlands | 16.9 million | 41,398.3 km² | 408.7 / km² |
Alteveer, Groningen Historical Population
Estimated Population from 1000 to 2015Sources:
1. JRC (European Commission's Joint Research Centre) work on the GHS built-up grid
2. CIESIN (Center for International Earth Science Information Network)
3. [Link] Klein Goldewijk, K., Beusen, A., Doelman, J., and Stehfest, E.: Anthropogenic land use estimates for the Holocene – HYDE 3.2, Earth Syst. Sci. Data, 9, 927–953, https://doi.org/10.5194/essd-9-927-2017, 2017.
Human Development Index (HDI)
Statistic composite index of life expectancy, education, and per capita income.Sources: [Link] Kummu, M., Taka, M. & Guillaume, J. Gridded global datasets for Gross Domestic Product and Human Development Index over 1990–2015. Sci Data 5, 180004 (2018) doi:10.1038/sdata.2018.4
Alteveer, Groningen CO2 Emissions
Carbon Dioxide (CO2) Emissions Per Capita in Tonnes Per Year| Location | CO2 Emissions | CO2 Emissions Per Capita | CO2 Emissions Intensity |
|---|---|---|---|
| Alteveer, Groningen | 6,956 tn | 11 tn | 12,717 tons/km² |
| Groningen | 5,335,411 tn | 9.27 tn | 1,897 tons/km² |
| Netherlands | 167,743,567 tn | 9.91 tn | 4,051 tons/km² |
Alteveer, Groningen CO2 Emissions
| 2013 CO2 emissions (tonnes/year) | 6,956 tn |
| 2013 CO2 emissions (tonnes/year) per capita | 11 tn |
| 2013 CO2 emissions intensity (tonnes/km²/year) | 12,717 tons/km² |
Recent Nearby Earthquakes
Magnitude 3.0 and greater| Date | Time | Magnitude | Distance | Depth | Location | Link |
|---|---|---|---|---|---|---|
| 5/21/19 | 8:48 PM | 3.2 | 46.8 km | 10,000 m | 8km NNE of Winsum, Netherlands | usgs.gov |
| 2/7/13 | 3:19 PM | 3.4 | 47 km | 10,000 m | 11km NNE of Winsum, Netherlands | usgs.gov |
| 8/16/12 | 1:30 PM | 3.4 | 36.2 km | 3,000 m | The Netherlands | usgs.gov |
| 10/29/08 | 10:54 PM | 3.3 | 44.9 km | 3,000 m | The Netherlands | usgs.gov |
| 7/18/08 | 11:12 AM | 3.4 | 92 km | 5,000 m | Germany | usgs.gov |
| 3/20/07 | 12:54 PM | 3.7 | 87.1 km | 10,000 m | Germany | usgs.gov |
| 8/7/06 | 10:03 PM | 3.8 | 46.3 km | 10,000 m | The Netherlands | usgs.gov |
| 11/9/03 | 4:22 PM | 3.1 | 58.5 km | 10,000 m | The Netherlands | usgs.gov |
| 1/6/03 | 1:49 PM | 4.3 | 91.6 km | 10,000 m | Germany | usgs.gov |
| 5/15/91 | 7:06 PM | 4.7 | 93.7 km | 10,000 m | Germany | usgs.gov |
Find historical earthquake occurrences near Alteveer, Groningen
Earliest Date Latest Date
Magnitude 3.0 and greater Magnitude 4.0 and greater Magnitude 5.0 and greater

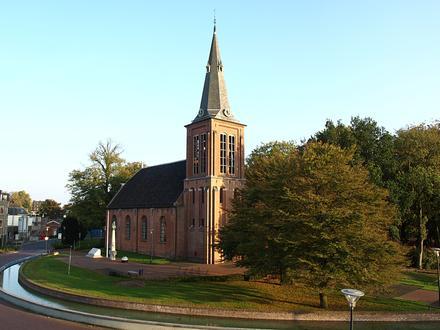
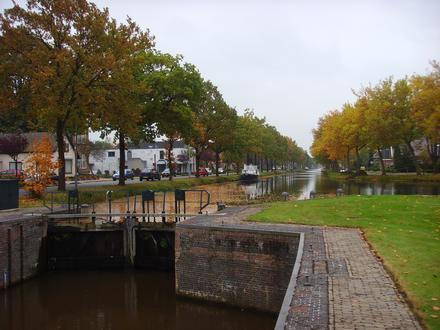
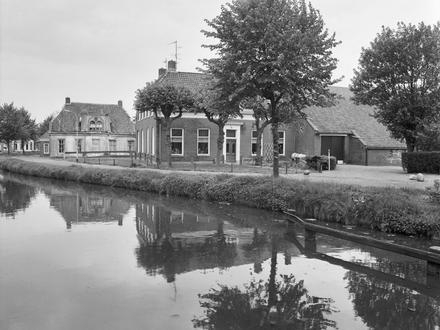
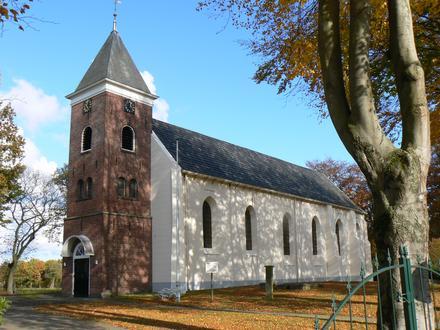
Alteveer, Groningen
Alteveer (Dutch pronunciation: [ˈɑltəveːr]) is a village in the Dutch province of Groningen. It is largely located in the municipality Stadskanaal, about 7 km northeast of the centre of Stadskanaal. The mouses on the western edge of the village are p.. Alteveer, Groningen Wikipedia Page
About Our Data
The data on this page is estimated using a number of publicly available tools and resources. It is provided without warranty, and could contain inaccuracies. Use at your own risk. See here for more information.