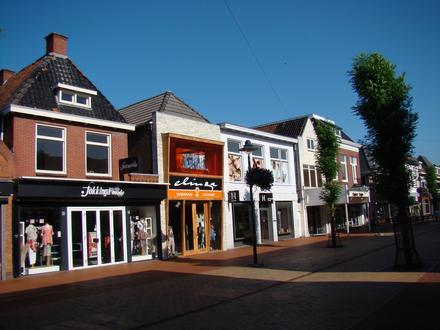
Businesses in Beetsterzwaag
Hotels & Travel
Restaurants
Automotive
Financial Services
Medical
Beauty & Spas
Community & Government
Industries
Business Distribution by Industry Professional Services: 19.9%
Shopping: 13.9%
Industry: 10.4%
Medical: 9.6%
Home Services: 7.1%
Restaurants: 6.4%
Education: 5.4%
Other: 27.3%
| Industry Description | Number of Establishments | Average Google Rating | Businesses per 1,000 residents |
|---|---|---|---|
| Beauty salons | 7 | 4.6 | 2.6 |
| Other construction | 6 | 2.2 | |
| Other accommodation | 5 | 4.6 | 1.8 |
| Civil engineering | 5 | 5.0 | 1.8 |
| Health and medical | 29 | 4.5 | 10.7 |
| Lawyers legal | 8 | 5.0 | 3.0 |
| Specialized design | 7 | 2.6 |
| Area of Beetsterzwaag, Friesland | 14.9 km² |
| Population | 2,710 |
| Male Population | 1,353 (49.9%) |
| Female Population | 1,357 (50.1%) |
| Population change from 1975 to 2015 | -14.3% |
| Population change from 2000 to 2015 | -7.9% |
| Median Age | 42.4 |
| Male Median Age | 41.6 |
| Female Median Age | 43.2 |
| Area Codes | 512 |
| Local Time | Friday 8:55 AM |
| Timezone | Central European Summer Time |
| Lat & Lng | 53.05914° / 6.07711° |
| Postal Codes | 9244 |
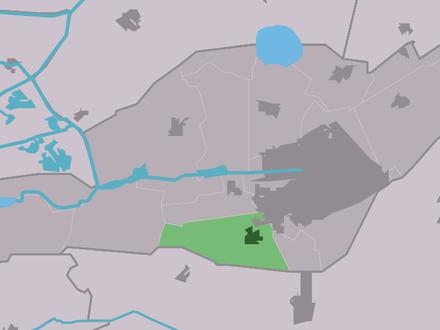
Beetsterzwaag, Friesland - Map
Beetsterzwaag, Friesland Population
Years 1975 to 2015| Data | 1975 | 1990 | 2000 | 2015 |
|---|---|---|---|---|
| Population | 3,164 | 3,258 | 2,942 | 2,710 |
| Population Density | 212.7 / km² | 219.0 / km² | 197.8 / km² | 182.2 / km² |
Beetsterzwaag Population change from 2000 to 2015
Decrease of 7.9% from year 2000 to 2015| Location | Change since 1975 | Change since 1990 | Change since 2000 |
|---|---|---|---|
| Beetsterzwaag, Friesland | -14.3% | -16.8% | -7.9% |
| Friesland | +18.8% | +9.6% | +4.1% |
| Netherlands | +24.3% | +13.4% | +6.5% |
Beetsterzwaag, Friesland Median Age
Median Age: 42.4 years| Location | Median Age | Median Age (Female) | Median Age (Male) |
|---|---|---|---|
| Beetsterzwaag, Friesland | 42.4 years | 43.2 years | 41.6 years |
| Friesland | 42 years | 42.9 years | 41 years |
| Netherlands | 41 years | 41.7 years | 40.2 years |
Beetsterzwaag, Friesland Population Tree
Population By Age and Gender| Age | Male | Female | Total |
|---|---|---|---|
| Under 5 | 77 | 74 | 152 |
| 5-9 | 91 | 85 | 177 |
| 10-14 | 94 | 93 | 188 |
| 15-19 | 91 | 80 | 172 |
| 20-24 | 70 | 60 | 130 |
| 25-29 | 67 | 60 | 127 |
| 30-34 | 66 | 68 | 134 |
| 35-39 | 85 | 87 | 173 |
| 40-44 | 109 | 110 | 219 |
| 45-49 | 110 | 103 | 214 |
| 50-54 | 105 | 103 | 208 |
| 55-59 | 94 | 92 | 187 |
| 60-64 | 90 | 94 | 185 |
| 65-69 | 73 | 70 | 143 |
| 70-74 | 51 | 57 | 109 |
| 75-79 | 40 | 47 | 88 |
| 80-84 | 24 | 38 | 63 |
| 85 Plus | 16 | 35 | 51 |
Beetsterzwaag, Friesland Population Density
Population Density: 182.2 / km²| Location | Population | Area | Population Density |
|---|---|---|---|
| Beetsterzwaag, Friesland | 2,710 | 14.9 km² | 182.2 / km² |
| Friesland | 653,256 | 5,751.4 km² | 113.6 / km² |
| Netherlands | 16.9 million | 41,398.3 km² | 408.7 / km² |
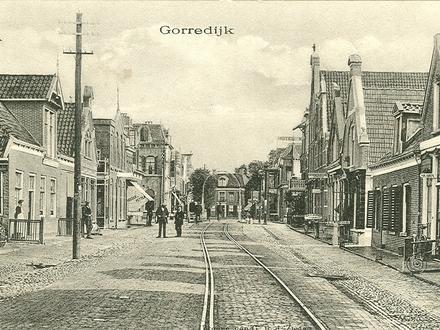
Beetsterzwaag, Friesland Historical Population
Estimated Ancient Population until 2015Sources:
1. JRC (European Commission's Joint Research Centre) work on the GHS built-up grid
2. CIESIN (Center for International Earth Science Information Network)
3. [Link] Klein Goldewijk, K., Beusen, A., Doelman, J., and Stehfest, E.: Anthropogenic land use estimates for the Holocene – HYDE 3.2, Earth Syst. Sci. Data, 9, 927–953, https://doi.org/10.5194/essd-9-927-2017, 2017.
Area Codes
Percentage Area Codes used by businesses in Beetsterzwaag Area Code 512: 70.5%
Area Code 6: 21.7%
Other: 7.8%
Business distribution by price for Beetsterzwaag, Friesland
Inexpensive: 47.1%
Expensive: 29.4%
Moderate: 17.6%
Very Expensive: 5.9%
Human Development Index (HDI)
Statistic composite index of life expectancy, education, and per capita income.Sources: [Link] Kummu, M., Taka, M. & Guillaume, J. Gridded global datasets for Gross Domestic Product and Human Development Index over 1990–2015. Sci Data 5, 180004 (2018) doi:10.1038/sdata.2018.4
Beetsterzwaag, Friesland CO2 Emissions
Carbon Dioxide (CO2) Emissions Per Capita in Tonnes Per Year| Location | CO2 Emissions | CO2 Emissions Per Capita | CO2 Emissions Intensity |
|---|---|---|---|
| Beetsterzwaag, Friesland | 30,512 tn | 11.3 tn | 2,051 tons/km² |
| Friesland | 4,518,083 tn | 6.92 tn | 785.6 tons/km² |
| Netherlands | 167,743,567 tn | 9.91 tn | 4,051 tons/km² |
Beetsterzwaag, Friesland CO2 Emissions
| 2013 CO2 emissions (tonnes/year) | 30,512 tn |
| 2013 CO2 emissions (tonnes/year) per capita | 11.3 tn |
| 2013 CO2 emissions intensity (tonnes/km²/year) | 2,051 tons/km² |
Recent Nearby Earthquakes
Magnitude 3.0 and greater| Date | Time | Magnitude | Distance | Depth | Location | Link |
|---|---|---|---|---|---|---|
| 5/21/19 | 8:48 PM | 3.2 | 50.4 km | 10,000 m | 8km NNE of Winsum, Netherlands | usgs.gov |
| 2/7/13 | 3:19 PM | 3.4 | 53.4 km | 10,000 m | 11km NNE of Winsum, Netherlands | usgs.gov |
| 8/16/12 | 1:30 PM | 3.4 | 55 km | 3,000 m | The Netherlands | usgs.gov |
| 10/29/08 | 10:54 PM | 3.3 | 49.9 km | 3,000 m | The Netherlands | usgs.gov |
| 8/7/06 | 10:03 PM | 3.8 | 45.6 km | 10,000 m | The Netherlands | usgs.gov |
| 11/9/03 | 4:22 PM | 3.1 | 39.3 km | 10,000 m | The Netherlands | usgs.gov |

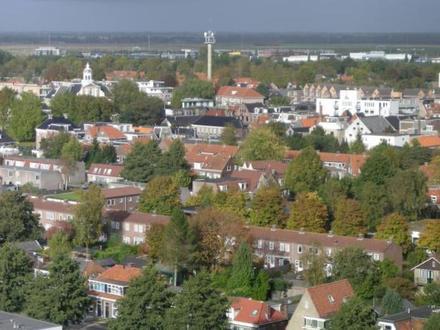
Beetsterzwaag, Friesland
Beetsterzwaag (West Frisian: Beetstersweach) is a village of about 3,650 inhabitants in the municipality of Opsterland in the east of Friesland in the Netherlands. most famous inhabitant was the Dutch poet J. Slauerhoff, who in May–July 1929 ran the.. Beetsterzwaag Wikipedia Page
About Our Data
The data on this page is estimated using a number of publicly available tools and resources. It is provided without warranty, and could contain inaccuracies. Use at your own risk. See here for more information.