- World
- »
- NL
- »
- Gelderland
- »
- Loenen, Apeldoorn
Businesses in Loenen, Apeldoorn
Hotels & Travel
Restaurants
Automotive
Financial Services
Medical
Beauty & Spas
Community & Government
Industries
Business Distribution by Industry Shopping: 17.1%
Industry: 14.2%
Professional Services: 14.1%
Home Services: 7.5%
Hotels & Travel: 6.5%
Automotive: 6.1%
Medical: 5.5%
Education: 5.3%
Other: 23.7%
| Area of Loenen, Apeldoorn | 36.9 km² |
| Population | 4,627 |
| Male Population | 2,284 (49.4%) |
| Female Population | 2,343 (50.6%) |
| Population change from 1975 to 2015 | -32.9% |
| Population change from 2000 to 2015 | -1.6% |
| Median Age | 42.7 |
| Male Median Age | 41.6 |
| Female Median Age | 43.8 |
| Area Codes | 55 |
| Local Time | Monday 5:55 AM |
| Timezone | Central European Summer Time |
| Lat & Lng | 52.1175° / 6.01944° |
| Postal Codes | 7371 |
Loenen, Apeldoorn - Map
Loenen, Apeldoorn Population
Years 1975 to 2015| Data | 1975 | 1990 | 2000 | 2015 |
|---|---|---|---|---|
| Population | 6,894 | 4,722 | 4,701 | 4,627 |
| Population Density | 186.8 / km² | 128.0 / km² | 127.4 / km² | 125.4 / km² |
Loenen, Apeldoorn Population change from 2000 to 2015
Decrease of 1.6% from year 2000 to 2015| Location | Change since 1975 | Change since 1990 | Change since 2000 |
|---|---|---|---|
| Loenen, Apeldoorn | -32.9% | -2% | -1.6% |
| Gelderland | +23% | +12.2% | +5.6% |
| Netherlands | +24.3% | +13.4% | +6.5% |
Loenen, Apeldoorn Median Age
Median Age: 42.7 years| Location | Median Age | Median Age (Female) | Median Age (Male) |
|---|---|---|---|
| Loenen, Apeldoorn | 42.7 years | 43.8 years | 41.6 years |
| Gelderland | 41.5 years | 42.3 years | 40.7 years |
| Netherlands | 41 years | 41.7 years | 40.2 years |
Loenen, Apeldoorn Population Tree
Population By Age and Gender| Age | Male | Female | Total |
|---|---|---|---|
| Under 5 | 127 | 117 | 244 |
| 5-9 | 142 | 133 | 276 |
| 10-14 | 143 | 136 | 280 |
| 15-19 | 147 | 132 | 279 |
| 20-24 | 126 | 117 | 244 |
| 25-29 | 120 | 118 | 239 |
| 30-34 | 127 | 127 | 255 |
| 35-39 | 153 | 157 | 311 |
| 40-44 | 180 | 176 | 357 |
| 45-49 | 185 | 178 | 363 |
| 50-54 | 172 | 173 | 345 |
| 55-59 | 158 | 159 | 318 |
| 60-64 | 165 | 171 | 337 |
| 65-69 | 112 | 119 | 231 |
| 70-74 | 89 | 101 | 190 |
| 75-79 | 64 | 88 | 152 |
| 80-84 | 45 | 69 | 115 |
| 85 Plus | 28 | 72 | 100 |
Loenen, Apeldoorn Population Density
Population Density: 125.4 / km²| Location | Population | Area | Population Density |
|---|---|---|---|
| Loenen, Apeldoorn | 4,627 | 36.9 km² | 125.4 / km² |
| Gelderland | 2.0 million | 5,135.4 km² | 395.0 / km² |
| Netherlands | 16.9 million | 41,398.3 km² | 408.7 / km² |
Loenen, Apeldoorn Projected Population
Estimated Population from 1975 to 2100Sources:
1. JRC (European Commission's Joint Research Centre) work on the GHS built-up grid
2. CIESIN (Center for International Earth Science Information Network)
3. [Link] Klein Goldewijk, K., Beusen, A., Doelman, J., and Stehfest, E.: Anthropogenic land use estimates for the Holocene – HYDE 3.2, Earth Syst. Sci. Data, 9, 927–953, https://doi.org/10.5194/essd-9-927-2017, 2017.
Area Codes
Percentage Area Codes used by businesses in Loenen, Apeldoorn Area Code 294: 54.7%
Area Code 55: 40.2%
Other: 5.1%
Human Development Index (HDI)
Statistic composite index of life expectancy, education, and per capita income.Sources: [Link] Kummu, M., Taka, M. & Guillaume, J. Gridded global datasets for Gross Domestic Product and Human Development Index over 1990–2015. Sci Data 5, 180004 (2018) doi:10.1038/sdata.2018.4
Loenen, Apeldoorn CO2 Emissions
Carbon Dioxide (CO2) Emissions Per Capita in Tonnes Per Year| Location | CO2 Emissions | CO2 Emissions Per Capita | CO2 Emissions Intensity |
|---|---|---|---|
| Loenen, Apeldoorn | 53,075 tn | 11.5 tn | 1,438 tons/km² |
| Gelderland | 23,051,858 tn | 11.4 tn | 4,488 tons/km² |
| Netherlands | 167,743,567 tn | 9.91 tn | 4,051 tons/km² |
Loenen, Apeldoorn CO2 Emissions
| 2013 CO2 emissions (tonnes/year) | 53,075 tn |
| 2013 CO2 emissions (tonnes/year) per capita | 11.5 tn |
| 2013 CO2 emissions intensity (tonnes/km²/year) | 1,438 tons/km² |
Natural Hazards Risk
Relative risk out of 10| Flood | Medium (4) |
* Risk, particularly concerning flood or landslide, may not be for the entire area.
Sources: 1. Dilley, M., R.S. Chen, U. Deichmann, A.L. Lerner-Lam, M. Arnold, J. Agwe, P. Buys, O. Kjekstad, B. Lyon, and G. Yetman. 2005. Natural Disaster Hotspots: A Global Risk Analysis. Washington, D.C.: World Bank. https://doi.org/10.1596/0-8213-5930-4.
2. Center for Hazards and Risk Research - CHRR - Columbia University, Center for International Earth Science Information Network - CIESIN - Columbia University. 2005. Global Flood Hazard Frequency and Distribution. Palisades, NY: NASA Socioeconomic Data and Applications Center (SEDAC). https://doi.org/10.7927/H4668B3D.
Recent Nearby Earthquakes
Magnitude 3.0 and greater| Date | Time | Magnitude | Distance | Depth | Location | Link |
|---|---|---|---|---|---|---|
| 9/8/11 | 12:02 PM | 4.2 | 48.3 km | 6,000 m | Germany | usgs.gov |
| 7/23/09 | 7:58 PM | 4.1 | 74.5 km | 5,000 m | Germany | usgs.gov |
| 12/25/08 | 5:53 AM | 3.2 | 80 km | 1,000 m | Germany | usgs.gov |
| 12/9/08 | 7:28 PM | 3.3 | 63.7 km | 10,000 m | Germany | usgs.gov |
| 11/12/08 | 12:56 PM | 3.4 | 83.9 km | 1,000 m | Germany | usgs.gov |
| 9/18/08 | 7:33 AM | 3.2 | 67.6 km | 1,000 m | Germany | usgs.gov |
| 5/13/08 | 2:55 AM | 3.3 | 73.9 km | 1,000 m | Germany | usgs.gov |
| 5/1/08 | 11:54 PM | 3.1 | 75.3 km | 1,000 m | Germany | usgs.gov |
| 4/23/08 | 5:10 AM | 3.1 | 75.9 km | 1,000 m | Germany | usgs.gov |
| 3/11/08 | 11:17 AM | 3.4 | 91.1 km | 10,000 m | Germany | usgs.gov |
Find historical earthquake occurrences near Loenen, Apeldoorn
Earliest Date Latest Date
Magnitude 3.0 and greater Magnitude 4.0 and greater Magnitude 5.0 and greater

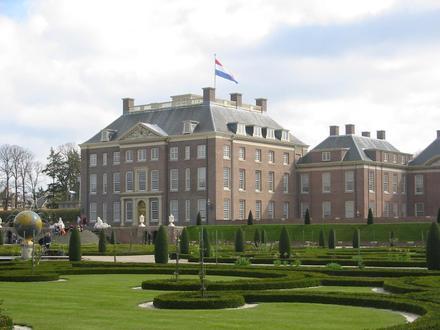
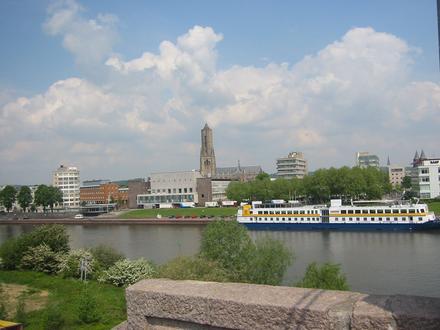
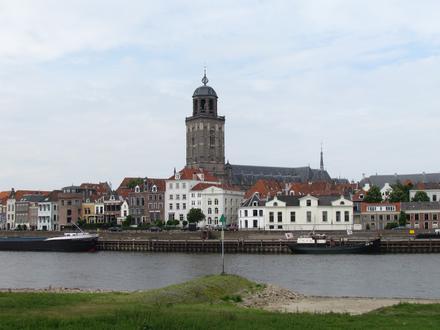
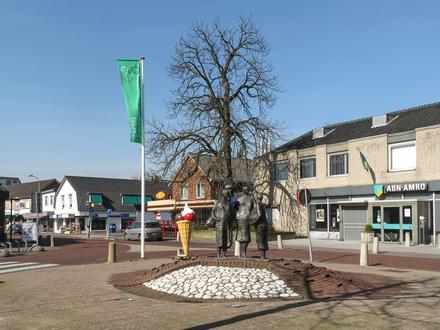
Loenen, Apeldoorn
Loenen is a village in the Dutch province of Gelderland. It is located in the municipality of Apeldoorn, about 10 km southeast of that city. was a separate municipality until 1818, when it was merged with Apeldoorn. Loenen, Apeldoorn Wikipedia Page
Postal Codes
Percentage of businesses by Postal Codes in Loenen, Apeldoorn Postal Code 7371: 88%
Postal Code 3632: 10.7%
Other: 1.3%
About Our Data
The data on this page is estimated using a number of publicly available tools and resources. It is provided without warranty, and could contain inaccuracies. Use at your own risk. See here for more information.