Businesses in Oterleek
Industries
Business Distribution by Industry Professional Services: 20.3%
Home Services: 16.5%
Industry: 16%
Shopping: 9%
Food: 7.1%
Hotels & Travel: 6.6%
Automotive: 5.2%
Beauty & Spas: 4.7%
Other: 14.6%
| Industry Description | Number of Establishments | Average Google Rating | Businesses per 1,000 residents |
|---|---|---|---|
| Other construction | 8 | 4.7 | 108.1 |
| Area of Oterleek, North Holland | 0.187 km² |
| Population | 74 |
| Male Population | 37 (50.4%) |
| Female Population | 37 (49.6%) |
| Population change from 1975 to 2015 | +19.4% |
| Population change from 2000 to 2015 | 0% |
| Median Age | 39 |
| Male Median Age | 38.7 |
| Female Median Age | 39.3 |
| Area Codes | 72 |
| Local Time | Thursday 5:33 AM |
| Timezone | Central European Summer Time |
| Lat & Lng | 52.63667° / 4.83472° |
| Postal Codes | 1842 |
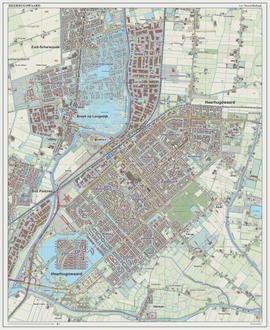
Oterleek, North Holland - Map
Oterleek, North Holland Population
Years 1975 to 2015| Data | 1975 | 1990 | 2000 | 2015 |
|---|---|---|---|---|
| Population | 62 | 70 | 74 | 74 |
| Population Density | 330.9 / km² | 373.6 / km² | 394.9 / km² | 394.9 / km² |
Oterleek Population change from 2000 to 2015
Decrease of 0% from year 2000 to 2015| Location | Change since 1975 | Change since 1990 | Change since 2000 |
|---|---|---|---|
| Oterleek, North Holland | +19.4% | +5.7% | 0% |
| Oterleek (city) | +61% | +31.8% | +21.4% |
| Noord-Holland | +32.8% | +18.1% | +9% |
| Netherlands | +24.3% | +13.4% | +6.5% |
Oterleek, North Holland Median Age
Median Age: 39 years| Location | Median Age | Median Age (Female) | Median Age (Male) |
|---|---|---|---|
| Oterleek, North Holland | 39 years | 39.3 years | 38.7 years |
| Oterleek (city) | 40.2 years | 40.3 years | 40.1 years |
| Noord-Holland | 40.4 years | 40.9 years | 39.9 years |
| Netherlands | 41 years | 41.7 years | 40.2 years |
Oterleek, North Holland Population Density
Population Density: 394.9 / km²| Location | Population | Area | Population Density |
|---|---|---|---|
| Oterleek, North Holland | 74 | 0.187 km² | 394.9 / km² |
| Oterleek (city) | 726 | 10 km² | 72.3 / km² |
| Noord-Holland | 2.8 million | 4,094.3 km² | 671.9 / km² |
| Netherlands | 16.9 million | 41,398.3 km² | 408.7 / km² |
Oterleek, North Holland Historical and Projected Population
Estimated Ancient Population until 2100Sources:
1. JRC (European Commission's Joint Research Centre) work on the GHS built-up grid
2. CIESIN (Center for International Earth Science Information Network)
3. [Link] Klein Goldewijk, K., Beusen, A., Doelman, J., and Stehfest, E.: Anthropogenic land use estimates for the Holocene – HYDE 3.2, Earth Syst. Sci. Data, 9, 927–953, https://doi.org/10.5194/essd-9-927-2017, 2017.
Area Codes
Percentage Area Codes used by businesses in Oterleek Area Code 72: 73.3%
Area Code 6: 22.8%
Other: 4%
Business distribution by price for Oterleek, North Holland
Inexpensive: 75%
Moderate: 12.5%
Expensive: 12.5%
Human Development Index (HDI)
Statistic composite index of life expectancy, education, and per capita income.Sources: [Link] Kummu, M., Taka, M. & Guillaume, J. Gridded global datasets for Gross Domestic Product and Human Development Index over 1990–2015. Sci Data 5, 180004 (2018) doi:10.1038/sdata.2018.4
Oterleek, North Holland CO2 Emissions
Carbon Dioxide (CO2) Emissions Per Capita in Tonnes Per Year| Location | CO2 Emissions | CO2 Emissions Per Capita | CO2 Emissions Intensity |
|---|---|---|---|
| Oterleek, North Holland | 876.4 tn | 11.8 tn | 4,677 tons/km² |
| Oterleek (city) | 8,597 tn | 11.8 tn | 855.9 tons/km² |
| Noord-Holland | 23,619,213 tn | 8.59 tn | 5,768 tons/km² |
| Netherlands | 167,743,567 tn | 9.91 tn | 4,051 tons/km² |
Oterleek, North Holland CO2 Emissions
| 2013 CO2 emissions (tonnes/year) | 876.4 tn |
| 2013 CO2 emissions (tonnes/year) per capita | 11.8 tn |
| 2013 CO2 emissions intensity (tonnes/km²/year) | 4,677 tons/km² |
Recent Nearby Earthquakes
Magnitude 3.0 and greater| Date | Time | Magnitude | Distance | Depth | Location | Link |
|---|---|---|---|---|---|---|
| 9/11/01 | 5:47 PM | 3.7 | 70.7 km | 10,000 m | North Sea | usgs.gov |
| 9/9/01 | 9:30 PM | 3.4 | 31.6 km | 10,000 m | The Netherlands | usgs.gov |
| 9/8/01 | 11:58 PM | 3.8 | 21.5 km | 10,000 m | The Netherlands | usgs.gov |
| 7/28/95 | 12:24 PM | 4 | 38.8 km | 10,000 m | The Netherlands | usgs.gov |
| 9/20/94 | 6:12 PM | 3.4 | 27.6 km | 5,000 m | The Netherlands | usgs.gov |
| 7/26/93 | 11:07 PM | 3.5 | 94.4 km | 10,000 m | North Sea | usgs.gov |
| 12/1/89 | 12:09 PM | 3.1 | 31.9 km | 10,000 m | The Netherlands | usgs.gov |
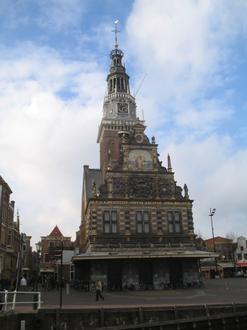
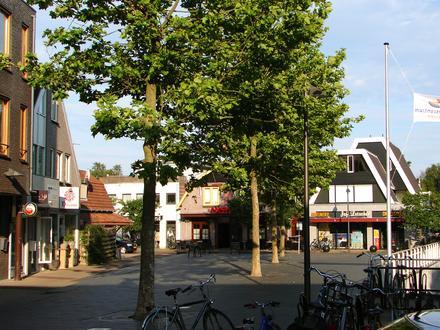
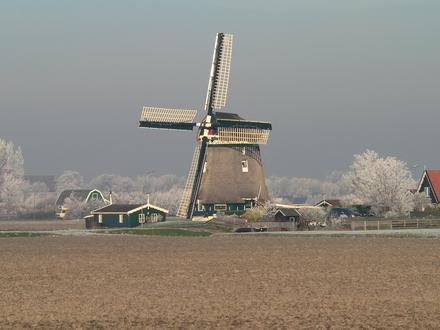
Oterleek, North Holland
Oterleek is a village in the Dutch province of North Holland. It is a part of the municipality of Alkmaar, and lies about 4 km south of Heerhugowaard. was a separate municipality between 1817 and 1970, when it was merged with Schermer. 2001, the vi.. Oterleek Wikipedia Page
About Our Data
The data on this page is estimated using a number of publicly available tools and resources. It is provided without warranty, and could contain inaccuracies. Use at your own risk. See here for more information.