- World
- »
- NL
- »
- Zeeland
- »
- Retranchement, Zeeland
Businesses in Retranchement
Industries
Business Distribution by Industry Hotels & Travel: 30%
Restaurants: 15%
Shopping: 11.5%
Industry: 7%
Home Services: 7%
Food: 6.5%
Entertainment: 5%
Other: 18%
| Area of Retranchement, Zeeland | 0.3 km² |
| Population | 89 |
| Male Population | 43 (48.6%) |
| Female Population | 46 (51.4%) |
| Population change from 1975 to 2015 | -39% |
| Population change from 2000 to 2015 | -12.7% |
| Median Age | 50.7 |
| Male Median Age | 49.3 |
| Female Median Age | 52.1 |
| Area Codes | 117 |
| Local Time | Thursday 5:33 AM |
| Timezone | Central European Summer Time |
| Lat & Lng | 51.3475° / 3.38472° |
| Postal Codes | 4525 |
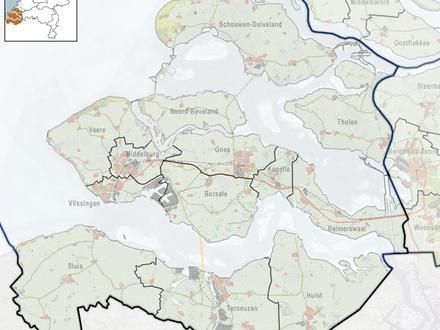
Retranchement, Zeeland - Map
Retranchement, Zeeland Population
Years 1975 to 2015| Data | 1975 | 1990 | 2000 | 2015 |
|---|---|---|---|---|
| Population | 146 | 126 | 102 | 89 |
| Population Density | 487.1 / km² | 420.4 / km² | 340.3 / km² | 296.9 / km² |
Retranchement Population change from 2000 to 2015
Decrease of 12.7% from year 2000 to 2015| Location | Change since 1975 | Change since 1990 | Change since 2000 |
|---|---|---|---|
| Retranchement, Zeeland | -39% | -29.4% | -12.7% |
| Retranchement (city) | -17.4% | -20.6% | -5.6% |
| Zeeland | +14.6% | +7.3% | +2.8% |
| Netherlands | +24.3% | +13.4% | +6.5% |
Retranchement, Zeeland Median Age
Median Age: 50.7 years| Location | Median Age | Median Age (Female) | Median Age (Male) |
|---|---|---|---|
| Retranchement, Zeeland | 50.7 years | 52.1 years | 49.3 years |
| Retranchement (city) | 49.3 years | 50.5 years | 48.1 years |
| Zeeland | 43.8 years | 44.8 years | 42.7 years |
| Netherlands | 41 years | 41.7 years | 40.2 years |
Retranchement, Zeeland Population Density
Population Density: 296.9 / km²| Location | Population | Area | Population Density |
|---|---|---|---|
| Retranchement, Zeeland | 89 | 0.3 km² | 296.9 / km² |
| Retranchement (city) | 624 | 10.3 km² | 60.8 / km² |
| Zeeland | 384,368 | 2,932.7 km² | 131.1 / km² |
| Netherlands | 16.9 million | 41,398.3 km² | 408.7 / km² |
Retranchement, Zeeland Projected Population
Estimated Population from 1975 to 2100Sources:
1. JRC (European Commission's Joint Research Centre) work on the GHS built-up grid
2. CIESIN (Center for International Earth Science Information Network)
3. [Link] Klein Goldewijk, K., Beusen, A., Doelman, J., and Stehfest, E.: Anthropogenic land use estimates for the Holocene – HYDE 3.2, Earth Syst. Sci. Data, 9, 927–953, https://doi.org/10.5194/essd-9-927-2017, 2017.
Area Codes
Percentage Area Codes used by businesses in Retranchement Area Code 117: 86.8%
Area Code 6: 7.5%
Other: 5.7%
Human Development Index (HDI)
Statistic composite index of life expectancy, education, and per capita income.Sources: [Link] Kummu, M., Taka, M. & Guillaume, J. Gridded global datasets for Gross Domestic Product and Human Development Index over 1990–2015. Sci Data 5, 180004 (2018) doi:10.1038/sdata.2018.4
Retranchement, Zeeland CO2 Emissions
Carbon Dioxide (CO2) Emissions Per Capita in Tonnes Per Year| Location | CO2 Emissions | CO2 Emissions Per Capita | CO2 Emissions Intensity |
|---|---|---|---|
| Retranchement, Zeeland | 1,140 tn | 12.8 tn | 3,804 tons/km² |
| Retranchement (city) | 7,994 tn | 12.8 tn | 779.1 tons/km² |
| Zeeland | 3,026,060 tn | 7.87 tn | 1,031 tons/km² |
| Netherlands | 167,743,567 tn | 9.91 tn | 4,051 tons/km² |
Retranchement, Zeeland CO2 Emissions
| 2013 CO2 emissions (tonnes/year) | 1,140 tn |
| 2013 CO2 emissions (tonnes/year) per capita | 12.8 tn |
| 2013 CO2 emissions intensity (tonnes/km²/year) | 3,804 tons/km² |
Natural Hazards Risk
Relative risk out of 10| Flood | Medium (4) |
* Risk, particularly concerning flood or landslide, may not be for the entire area.
Sources: 1. Dilley, M., R.S. Chen, U. Deichmann, A.L. Lerner-Lam, M. Arnold, J. Agwe, P. Buys, O. Kjekstad, B. Lyon, and G. Yetman. 2005. Natural Disaster Hotspots: A Global Risk Analysis. Washington, D.C.: World Bank. https://doi.org/10.1596/0-8213-5930-4.
2. Center for Hazards and Risk Research - CHRR - Columbia University, Center for International Earth Science Information Network - CIESIN - Columbia University. 2005. Global Flood Hazard Frequency and Distribution. Palisades, NY: NASA Socioeconomic Data and Applications Center (SEDAC). https://doi.org/10.7927/H4668B3D.
Recent Nearby Earthquakes
Magnitude 3.0 and greater
Retranchement, Zeeland
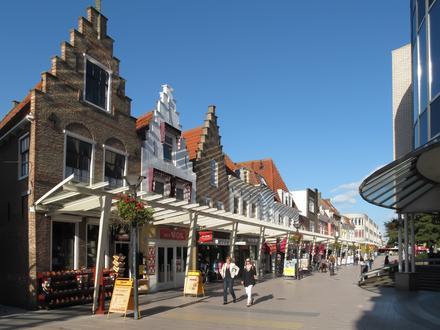
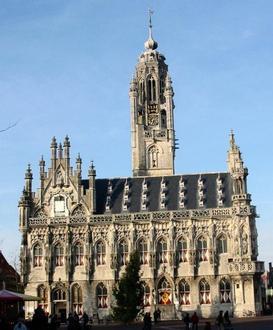
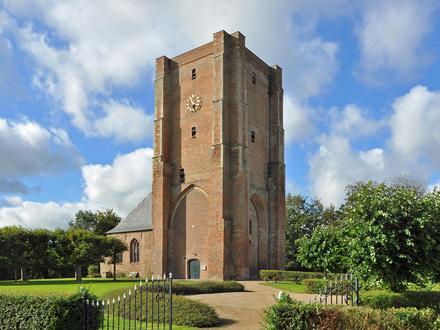
Retranchement is a village in the Dutch province of Zeeland. It is located on the Belgian border, about 9 km northwest of Oostburg, in the municipality of Sluis. was a separate municipality until 1970, when it was merged with Sluis. Retranchement Wikipedia Page
About Our Data
The data on this page is estimated using a number of publicly available tools and resources. It is provided without warranty, and could contain inaccuracies. Use at your own risk. See here for more information.