Businesses in Tegelen
Hotels & Travel
Restaurants
Automotive
Financial Services
Medical
Beauty & Spas
Community & Government
Industries
Business Distribution by Industry Shopping: 19.7%
Professional Services: 13.5%
Industry: 11.5%
Home Services: 7.2%
Restaurants: 7%
Beauty & Spas: 6.7%
Medical: 6.5%
Food: 5.2%
Other: 22.7%
| Industry Description | Number of Establishments | Average Google Rating | Businesses per 1,000 residents |
|---|---|---|---|
| Car repair | 15 | 4.2 | 1.4 |
| Beauty salons | 43 | 4.5 | 4.1 |
| Loan companies | 18 | 2.8 | 1.7 |
| Grocery stores and supermarkets | 22 | 4.1 | 2.1 |
| General contractors | 30 | 3.6 | 2.9 |
| Other construction | 22 | 4.3 | 2.1 |
| Construction of buildings | 18 | 4.9 | 1.7 |
| Wholesalers | 15 | 4.7 | 1.4 |
| Health and medical | 41 | 4.3 | 3.9 |
| Accountants | 24 | 3.0 | 2.3 |
| Cafes | 24 | 4.0 | 2.3 |
| Electronics stores | 26 | 4.2 | 2.5 |
| Household appliances and goods | 21 | 4.3 | 2.0 |
| Area of Tegelen, Limburg (Netherlands) | 1,040 km² |
| Population | 10,460 |
| Male Population | 5,179 (49.5%) |
| Female Population | 5,281 (50.5%) |
| Population change from 1975 to 2015 | -9.6% |
| Population change from 2000 to 2015 | -1.7% |
| Median Age | 43.3 |
| Male Median Age | 42.5 |
| Female Median Age | 44.1 |
| Area Codes | 77 |
| Local Time | Friday 4:52 AM |
| Timezone | Central European Summer Time |
| Lat & Lng | 51.34417° / 6.13611° |
| Postal Codes | 5912, 5931, 5932, 5935, 5951 |
Tegelen, Limburg (Netherlands) - Map
Tegelen, Limburg (Netherlands) Population
Years 1975 to 2015| Data | 1975 | 1990 | 2000 | 2015 |
|---|---|---|---|---|
| Population | 11,573 | 11,124 | 10,644 | 10,460 |
| Population Density | 11.1 / km² | 10.7 / km² | 10.2 / km² | 10.1 / km² |
Tegelen Population change from 2000 to 2015
Decrease of 1.7% from year 2000 to 2015| Location | Change since 1975 | Change since 1990 | Change since 2000 |
|---|---|---|---|
| Tegelen, Limburg (Netherlands) | -9.6% | -6% | -1.7% |
| Limburg | -0.8% | -1.8% | -2.6% |
| Netherlands | +24.3% | +13.4% | +6.5% |
Tegelen, Limburg (Netherlands) Median Age
Median Age: 43.3 years| Location | Median Age | Median Age (Female) | Median Age (Male) |
|---|---|---|---|
| Tegelen, Limburg (Netherlands) | 43.3 years | 44.1 years | 42.5 years |
| Limburg | 44.9 years | 45.7 years | 44.1 years |
| Netherlands | 41 years | 41.7 years | 40.2 years |
Tegelen, Limburg (Netherlands) Population Tree
Population By Age and Gender| Age | Male | Female | Total |
|---|---|---|---|
| Under 5 | 270 | 252 | 523 |
| 5-9 | 289 | 280 | 569 |
| 10-14 | 287 | 289 | 577 |
| 15-19 | 310 | 300 | 610 |
| 20-24 | 293 | 282 | 575 |
| 25-29 | 299 | 294 | 593 |
| 30-34 | 306 | 299 | 605 |
| 35-39 | 330 | 328 | 658 |
| 40-44 | 410 | 387 | 798 |
| 45-49 | 427 | 412 | 839 |
| 50-54 | 411 | 397 | 808 |
| 55-59 | 382 | 368 | 751 |
| 60-64 | 385 | 366 | 752 |
| 65-69 | 262 | 265 | 527 |
| 70-74 | 210 | 246 | 457 |
| 75-79 | 156 | 212 | 369 |
| 80-84 | 96 | 162 | 258 |
| 85 Plus | 56 | 143 | 199 |
Tegelen, Limburg (Netherlands) Population Density
Population Density: 10.1 / km²| Location | Population | Area | Population Density |
|---|---|---|---|
| Tegelen, Limburg (Netherlands) | 10,460 | 1,040 km² | 10.1 / km² |
| Limburg | 1.1 million | 2,210.3 km² | 507.1 / km² |
| Netherlands | 16.9 million | 41,398.3 km² | 408.7 / km² |
Area Codes
Percentage Area Codes used by businesses in Tegelen Area Code 77: 72.1%
Area Code 6: 23.4%
Other: 4.6%
Business distribution by price for Tegelen, Limburg (Netherlands)
Inexpensive: 54.3%
Moderate: 41.3%
Expensive: 4.3%
Human Development Index (HDI)
Statistic composite index of life expectancy, education, and per capita income.Sources: [Link] Kummu, M., Taka, M. & Guillaume, J. Gridded global datasets for Gross Domestic Product and Human Development Index over 1990–2015. Sci Data 5, 180004 (2018) doi:10.1038/sdata.2018.4
Tegelen, Limburg (Netherlands) CO2 Emissions
Carbon Dioxide (CO2) Emissions Per Capita in Tonnes Per Year| Location | CO2 Emissions | CO2 Emissions Per Capita | CO2 Emissions Intensity |
|---|---|---|---|
| Tegelen, Limburg (Netherlands) | 118,291 tn | 11.3 tn | 113.7 tons/km² |
| Limburg | 12,720,257 tn | 11.3 tn | 5,754 tons/km² |
| Netherlands | 167,743,567 tn | 9.91 tn | 4,051 tons/km² |
Tegelen, Limburg (Netherlands) CO2 Emissions
| 2013 CO2 emissions (tonnes/year) | 118,291 tn |
| 2013 CO2 emissions (tonnes/year) per capita | 11.3 tn |
| 2013 CO2 emissions intensity (tonnes/km²/year) | 113.7 tons/km² |
Natural Hazards Risk
Relative risk out of 10| Flood | High (7) |
| Earthquake | Low (2) |
* Risk, particularly concerning flood or landslide, may not be for the entire area.
Sources: 1. Dilley, M., R.S. Chen, U. Deichmann, A.L. Lerner-Lam, M. Arnold, J. Agwe, P. Buys, O. Kjekstad, B. Lyon, and G. Yetman. 2005. Natural Disaster Hotspots: A Global Risk Analysis. Washington, D.C.: World Bank. https://doi.org/10.1596/0-8213-5930-4.
2. Center for Hazards and Risk Research - CHRR - Columbia University, Center for International Earth Science Information Network - CIESIN - Columbia University. 2005. Global Flood Hazard Frequency and Distribution. Palisades, NY: NASA Socioeconomic Data and Applications Center (SEDAC). https://doi.org/10.7927/H4668B3D.
3. Center for Hazards and Risk Research - CHRR - Columbia University, Center for International Earth Science Information Network - CIESIN - Columbia University. 2005. Global Earthquake Hazard Distribution - Peak Ground Acceleration. Palisades, NY: NASA Socioeconomic Data and Applications Center (SEDAC). https://doi.org/10.7927/H4BZ63ZS.
Recent Nearby Earthquakes
Magnitude 3.0 and greater| Date | Time | Magnitude | Distance | Depth | Location | Link |
|---|---|---|---|---|---|---|
| 9/8/11 | 12:02 PM | 4.2 | 38.5 km | 6,000 m | Germany | usgs.gov |
| 7/23/09 | 7:58 PM | 4.1 | 33.4 km | 5,000 m | Germany | usgs.gov |
| 11/12/08 | 12:56 PM | 3.4 | 36 km | 1,000 m | Germany | usgs.gov |
| 9/18/08 | 7:33 AM | 3.2 | 42.5 km | 1,000 m | Germany | usgs.gov |
| 5/13/08 | 2:55 AM | 3.3 | 34.1 km | 1,000 m | Germany | usgs.gov |
| 5/1/08 | 11:54 PM | 3.1 | 37.8 km | 1,000 m | Germany | usgs.gov |
| 4/23/08 | 5:10 AM | 3.1 | 38 km | 1,000 m | Germany | usgs.gov |
| 3/11/08 | 11:17 AM | 3.4 | 26.8 km | 10,000 m | Germany | usgs.gov |
| 2/17/08 | 3:07 AM | 3.6 | 34.8 km | 1,000 m | Germany | usgs.gov |
| 1/23/08 | 7:30 PM | 3.7 | 28 km | 10,000 m | Germany | usgs.gov |
Find historical earthquake occurrences near Tegelen, Limburg (Netherlands)
Earliest Date Latest Date
Magnitude 3.0 and greater Magnitude 4.0 and greater Magnitude 5.0 and greater

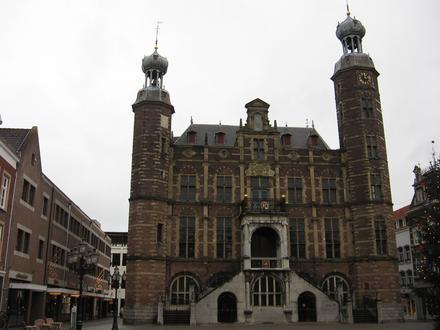
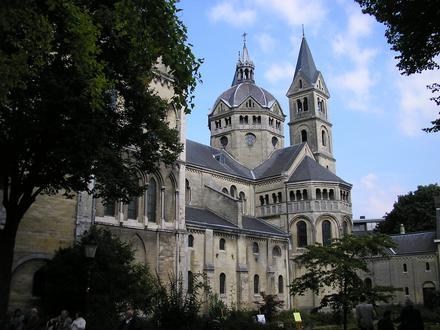
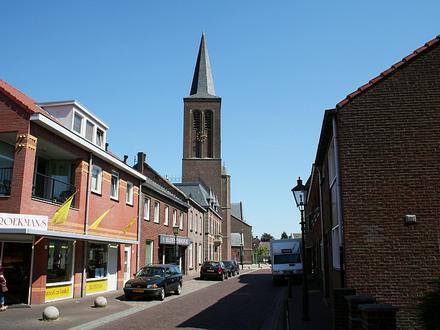
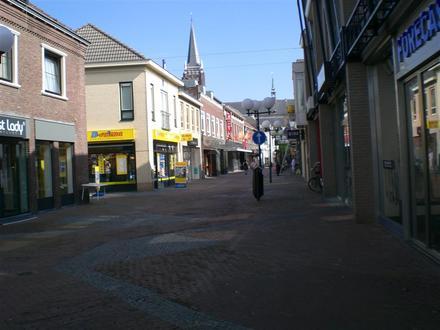
Tegelen, Limburg (Netherlands)
Tegelen (Limburgish: Tegele) is a village in the province of Limburg in the Netherlands. It was an independent municipality until 2001, when it was merged into the municipality of Venlo. Tegelen Wikipedia Page
Postal Codes
Percentage of businesses by Postal Codes in Tegelen Postal Code 5931: 69.2%
Postal Code 5932: 29.8%
Other: 0.9%
About Our Data
The data on this page is estimated using a number of publicly available tools and resources. It is provided without warranty, and could contain inaccuracies. Use at your own risk. See here for more information.