- World
- »
- NL
- »
- Gelderland
- »
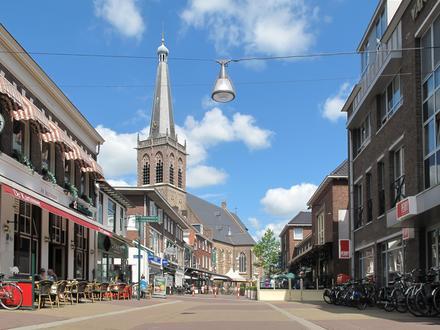
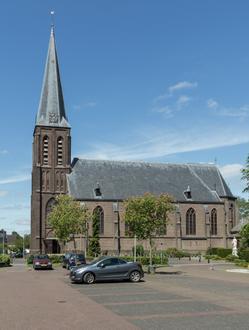
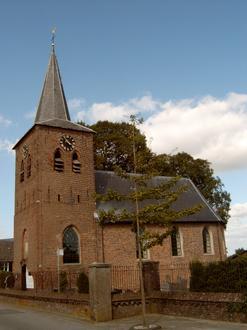
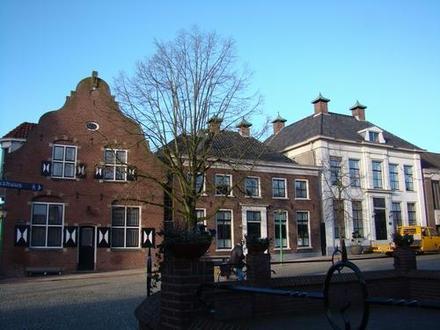
- Terborg, Gelderland
Businesses in Terborg
Hotels & Travel
Restaurants
Automotive
Financial Services
Medical
Beauty & Spas
Community & Government
Industries
Business Distribution by Industry Shopping: 18.8%
Professional Services: 14.8%
Industry: 13.9%
Home Services: 9.1%
Medical: 8.1%
Other: 35.3%
| Industry Description | Number of Establishments | Average Google Rating | Businesses per 1,000 residents |
|---|---|---|---|
| Beauty salons | 14 | 4.7 | 2.9 |
| Loan companies | 6 | 4.0 | 1.3 |
| Grocery stores and supermarkets | 11 | 4.2 | 2.3 |
| General contractors | 21 | 4.0 | 4.4 |
| Other construction | 10 | 4.2 | 2.1 |
| Plumbing installation and repair | 9 | 4.6 | 1.9 |
| Construction of buildings | 20 | 4.4 | 4.2 |
| Wholesalers | 12 | 4.5 | 2.5 |
| Health and medical | 22 | 4.9 | 4.6 |
| Hospitals | 9 | 5.0 | 1.9 |
| Cafes | 6 | 4.3 | 1.3 |
| Clothing stores | 6 | 4.2 | 1.3 |
| Electronics stores | 10 | 4.7 | 2.1 |
| Furniture stores | 12 | 4.1 | 2.5 |
| Household appliances and goods | 7 | 4.0 | 1.5 |
| Area of Terborg, Gelderland | 7.8 km² |
| Population | 4,762 |
| Male Population | 2,373 (49.8%) |
| Female Population | 2,389 (50.2%) |
| Population change from 1975 to 2015 | -29.4% |
| Population change from 2000 to 2015 | -7.1% |
| Median Age | 44.1 |
| Male Median Age | 43.1 |
| Female Median Age | 45 |
| Area Codes | 315 |
| Local Time | Sunday 7:59 AM |
| Timezone | Central European Summer Time |
| Lat & Lng | 51.92° / 6.35417° |
| Postal Codes | 7011, 7061, 7064 |
Terborg, Gelderland - Map
Terborg, Gelderland Population
Years 1975 to 2015| Data | 1975 | 1990 | 2000 | 2015 |
|---|---|---|---|---|
| Population | 6,744 | 5,797 | 5,124 | 4,762 |
| Population Density | 863.4 / km² | 742.2 / km² | 656.0 / km² | 609.7 / km² |
Terborg Population change from 2000 to 2015
Decrease of 7.1% from year 2000 to 2015| Location | Change since 1975 | Change since 1990 | Change since 2000 |
|---|---|---|---|
| Terborg, Gelderland | -29.4% | -17.9% | -7.1% |
| Gelderland | +23% | +12.2% | +5.6% |
| Netherlands | +24.3% | +13.4% | +6.5% |
Terborg, Gelderland Median Age
Median Age: 44.1 years| Location | Median Age | Median Age (Female) | Median Age (Male) |
|---|---|---|---|
| Terborg, Gelderland | 44.1 years | 45 years | 43.1 years |
| Gelderland | 41.5 years | 42.3 years | 40.7 years |
| Netherlands | 41 years | 41.7 years | 40.2 years |
Terborg, Gelderland Population Tree
Population By Age and Gender| Age | Male | Female | Total |
|---|---|---|---|
| Under 5 | 122 | 112 | 235 |
| 5-9 | 148 | 141 | 290 |
| 10-14 | 159 | 151 | 310 |
| 15-19 | 155 | 138 | 294 |
| 20-24 | 116 | 99 | 216 |
| 25-29 | 106 | 101 | 208 |
| 30-34 | 116 | 117 | 234 |
| 35-39 | 144 | 145 | 290 |
| 40-44 | 196 | 190 | 387 |
| 45-49 | 203 | 187 | 390 |
| 50-54 | 183 | 182 | 365 |
| 55-59 | 178 | 166 | 345 |
| 60-64 | 174 | 170 | 345 |
| 65-69 | 129 | 133 | 262 |
| 70-74 | 103 | 112 | 215 |
| 75-79 | 69 | 93 | 162 |
| 80-84 | 44 | 76 | 120 |
| 85 Plus | 29 | 74 | 103 |
Terborg, Gelderland Population Density
Population Density: 609.7 / km²| Location | Population | Area | Population Density |
|---|---|---|---|
| Terborg, Gelderland | 4,762 | 7.8 km² | 609.7 / km² |
| Gelderland | 2.0 million | 5,135.4 km² | 395.0 / km² |
| Netherlands | 16.9 million | 41,398.3 km² | 408.7 / km² |
Area Codes
Percentage Area Codes used by businesses in Terborg Area Code 315: 67.9%
Area Code 6: 22.1%
Other: 10%
Business distribution by price for Terborg, Gelderland
Inexpensive: 64.3%
Moderate: 28.6%
Very Expensive: 7.1%
Human Development Index (HDI)
Statistic composite index of life expectancy, education, and per capita income.Sources: [Link] Kummu, M., Taka, M. & Guillaume, J. Gridded global datasets for Gross Domestic Product and Human Development Index over 1990–2015. Sci Data 5, 180004 (2018) doi:10.1038/sdata.2018.4
Terborg, Gelderland CO2 Emissions
Carbon Dioxide (CO2) Emissions Per Capita in Tonnes Per Year| Location | CO2 Emissions | CO2 Emissions Per Capita | CO2 Emissions Intensity |
|---|---|---|---|
| Terborg, Gelderland | 53,610 tn | 11.3 tn | 6,863 tons/km² |
| Gelderland | 23,051,858 tn | 11.4 tn | 4,488 tons/km² |
| Netherlands | 167,743,567 tn | 9.91 tn | 4,051 tons/km² |
Terborg, Gelderland CO2 Emissions
| 2013 CO2 emissions (tonnes/year) | 53,610 tn |
| 2013 CO2 emissions (tonnes/year) per capita | 11.3 tn |
| 2013 CO2 emissions intensity (tonnes/km²/year) | 6,863 tons/km² |
Natural Hazards Risk
Relative risk out of 10| Flood | High (7) |
* Risk, particularly concerning flood or landslide, may not be for the entire area.
Sources: 1. Dilley, M., R.S. Chen, U. Deichmann, A.L. Lerner-Lam, M. Arnold, J. Agwe, P. Buys, O. Kjekstad, B. Lyon, and G. Yetman. 2005. Natural Disaster Hotspots: A Global Risk Analysis. Washington, D.C.: World Bank. https://doi.org/10.1596/0-8213-5930-4.
2. Center for Hazards and Risk Research - CHRR - Columbia University, Center for International Earth Science Information Network - CIESIN - Columbia University. 2005. Global Flood Hazard Frequency and Distribution. Palisades, NY: NASA Socioeconomic Data and Applications Center (SEDAC). https://doi.org/10.7927/H4668B3D.
Recent Nearby Earthquakes
Magnitude 3.0 and greater| Date | Time | Magnitude | Distance | Depth | Location | Link |
|---|---|---|---|---|---|---|
| 9/8/11 | 12:02 PM | 4.2 | 34.8 km | 6,000 m | Germany | usgs.gov |
| 7/23/09 | 7:58 PM | 4.1 | 45.5 km | 5,000 m | Germany | usgs.gov |
| 12/25/08 | 5:53 AM | 3.2 | 49.3 km | 1,000 m | Germany | usgs.gov |
| 12/9/08 | 7:28 PM | 3.3 | 32.9 km | 10,000 m | Germany | usgs.gov |
| 11/21/08 | 11:41 PM | 3.3 | 52.9 km | 1,000 m | Germany | usgs.gov |
| 11/12/08 | 12:56 PM | 3.4 | 54.3 km | 1,000 m | Germany | usgs.gov |
| 9/18/08 | 7:33 AM | 3.2 | 37.1 km | 1,000 m | Germany | usgs.gov |
| 5/13/08 | 2:55 AM | 3.3 | 44.8 km | 1,000 m | Germany | usgs.gov |
| 5/1/08 | 11:54 PM | 3.1 | 45.3 km | 1,000 m | Germany | usgs.gov |
| 4/23/08 | 5:10 AM | 3.1 | 46 km | 1,000 m | Germany | usgs.gov |
Find historical earthquake occurrences near Terborg, Gelderland
Earliest Date Latest Date
Magnitude 3.0 and greater Magnitude 4.0 and greater Magnitude 5.0 and greater

Terborg, Gelderland
Terborg is a small city in the Dutch province of Gelderland, in the Achterhoek region in the east of the Netherlands. It is located in the municipality of Oude IJsselstreek. The city lies about 7 km southeast of Doetinchem. The population is about 46.. Terborg Wikipedia Page
About Our Data
The data on this page is estimated using a number of publicly available tools and resources. It is provided without warranty, and could contain inaccuracies. Use at your own risk. See here for more information.