- World
- »
- NL
- »
- Gelderland
- »
- Ulft, Gelderland
Businesses in Ulft
Hotels & Travel
Restaurants
Automotive
Financial Services
Medical
Beauty & Spas
Community & Government
Industries
Business Distribution by Industry Shopping: 22%
Professional Services: 15.8%
Industry: 11.8%
Home Services: 8.9%
Beauty & Spas: 5.9%
Restaurants: 5.4%
Other: 30.1%
| Industry Description | Number of Establishments | Average Google Rating | Businesses per 1,000 residents |
|---|---|---|---|
| Car repair | 22 | 4.6 | 2.5 |
| Beauty salons | 34 | 4.8 | 3.9 |
| Hairdressers | 13 | 4.5 | 1.5 |
| Loan companies | 11 | 4.8 | 1.3 |
| Grocery stores and supermarkets | 14 | 4.2 | 1.6 |
| General contractors | 34 | 3.9 | 3.9 |
| Other construction | 28 | 4.4 | 3.2 |
| Construction of buildings | 27 | 3.9 | 3.1 |
| Wholesale of machinery | 12 | 4.1 | 1.4 |
| Wholesalers | 29 | 4.1 | 3.4 |
| Dentists | 11 | 4.2 | 1.3 |
| Health and medical | 22 | 5.0 | 2.5 |
| Accountants | 14 | 4.3 | 1.6 |
| Technical construction services | 15 | 5.0 | 1.7 |
| Bars, pubs and taverns | 12 | 2.0 | 1.4 |
| Cafes | 14 | 4.0 | 1.6 |
| Clothing stores | 16 | 4.1 | 1.9 |
| Electronics stores | 24 | 4.4 | 2.8 |
| Furniture stores | 21 | 3.9 | 2.4 |
| Hardware stores | 24 | 4.4 | 2.8 |
| Household appliances and goods | 21 | 4.1 | 2.4 |
| Office supplies and stationery stores | 13 | 4.5 | 1.5 |
| Area of Ulft, Gelderland | 5.2 km² |
| Population | 8,641 |
| Male Population | 4,312 (49.9%) |
| Female Population | 4,329 (50.1%) |
| Population change from 1975 to 2015 | +0.3% |
| Population change from 2000 to 2015 | -3% |
| Median Age | 44.4 |
| Male Median Age | 43.4 |
| Female Median Age | 45.3 |
| Area Codes | 315 |
| Local Time | Sunday 8:04 AM |
| Timezone | Central European Summer Time |
| Lat & Lng | 51.89° / 6.37778° |
| Postal Codes | 7071 |
Ulft, Gelderland - Map
Ulft, Gelderland Population
Years 1975 to 2015| Data | 1975 | 1990 | 2000 | 2015 |
|---|---|---|---|---|
| Population | 8,615 | 8,765 | 8,910 | 8,641 |
| Population Density | 1,658 / km² | 1,687 / km² | 1,715 / km² | 1,663 / km² |
Ulft Population change from 2000 to 2015
Decrease of 3% from year 2000 to 2015| Location | Change since 1975 | Change since 1990 | Change since 2000 |
|---|---|---|---|
| Ulft, Gelderland | +0.3% | -1.4% | -3% |
| Gelderland | +23% | +12.2% | +5.6% |
| Netherlands | +24.3% | +13.4% | +6.5% |
Ulft, Gelderland Median Age
Median Age: 44.4 years| Location | Median Age | Median Age (Female) | Median Age (Male) |
|---|---|---|---|
| Ulft, Gelderland | 44.4 years | 45.3 years | 43.4 years |
| Gelderland | 41.5 years | 42.3 years | 40.7 years |
| Netherlands | 41 years | 41.7 years | 40.2 years |
Ulft, Gelderland Population Tree
Population By Age and Gender| Age | Male | Female | Total |
|---|---|---|---|
| Under 5 | 218 | 203 | 421 |
| 5-9 | 270 | 255 | 526 |
| 10-14 | 291 | 274 | 565 |
| 15-19 | 284 | 250 | 535 |
| 20-24 | 207 | 176 | 384 |
| 25-29 | 186 | 176 | 362 |
| 30-34 | 205 | 207 | 412 |
| 35-39 | 256 | 261 | 518 |
| 40-44 | 356 | 344 | 700 |
| 45-49 | 371 | 340 | 712 |
| 50-54 | 332 | 330 | 662 |
| 55-59 | 328 | 302 | 631 |
| 60-64 | 319 | 310 | 630 |
| 65-69 | 238 | 246 | 485 |
| 70-74 | 193 | 205 | 398 |
| 75-79 | 126 | 171 | 297 |
| 80-84 | 79 | 140 | 220 |
| 85 Plus | 53 | 139 | 192 |
Ulft, Gelderland Population Density
Population Density: 1,663 / km²| Location | Population | Area | Population Density |
|---|---|---|---|
| Ulft, Gelderland | 8,641 | 5.2 km² | 1,663 / km² |
| Gelderland | 2.0 million | 5,135.4 km² | 395.0 / km² |
| Netherlands | 16.9 million | 41,398.3 km² | 408.7 / km² |
Ulft, Gelderland Historical Population
Estimated Ancient Population until 2015Sources:
1. JRC (European Commission's Joint Research Centre) work on the GHS built-up grid
2. CIESIN (Center for International Earth Science Information Network)
3. [Link] Klein Goldewijk, K., Beusen, A., Doelman, J., and Stehfest, E.: Anthropogenic land use estimates for the Holocene – HYDE 3.2, Earth Syst. Sci. Data, 9, 927–953, https://doi.org/10.5194/essd-9-927-2017, 2017.
Area Codes
Percentage Area Codes used by businesses in Ulft Area Code 315: 71.7%
Area Code 6: 21.7%
Other: 6.6%
Business distribution by price for Ulft, Gelderland
Inexpensive: 60%
Moderate: 37.1%
Expensive: 2.9%
Human Development Index (HDI)
Statistic composite index of life expectancy, education, and per capita income.Sources: [Link] Kummu, M., Taka, M. & Guillaume, J. Gridded global datasets for Gross Domestic Product and Human Development Index over 1990–2015. Sci Data 5, 180004 (2018) doi:10.1038/sdata.2018.4
Ulft, Gelderland CO2 Emissions
Carbon Dioxide (CO2) Emissions Per Capita in Tonnes Per Year| Location | CO2 Emissions | CO2 Emissions Per Capita | CO2 Emissions Intensity |
|---|---|---|---|
| Ulft, Gelderland | 97,670 tn | 11.3 tn | 18,808 tons/km² |
| Gelderland | 23,051,858 tn | 11.4 tn | 4,488 tons/km² |
| Netherlands | 167,743,567 tn | 9.91 tn | 4,051 tons/km² |
Ulft, Gelderland CO2 Emissions
| 2013 CO2 emissions (tonnes/year) | 97,670 tn |
| 2013 CO2 emissions (tonnes/year) per capita | 11.3 tn |
| 2013 CO2 emissions intensity (tonnes/km²/year) | 18,808 tons/km² |
Natural Hazards Risk
Relative risk out of 10| Flood | High (7) |
* Risk, particularly concerning flood or landslide, may not be for the entire area.
Sources: 1. Dilley, M., R.S. Chen, U. Deichmann, A.L. Lerner-Lam, M. Arnold, J. Agwe, P. Buys, O. Kjekstad, B. Lyon, and G. Yetman. 2005. Natural Disaster Hotspots: A Global Risk Analysis. Washington, D.C.: World Bank. https://doi.org/10.1596/0-8213-5930-4.
2. Center for Hazards and Risk Research - CHRR - Columbia University, Center for International Earth Science Information Network - CIESIN - Columbia University. 2005. Global Flood Hazard Frequency and Distribution. Palisades, NY: NASA Socioeconomic Data and Applications Center (SEDAC). https://doi.org/10.7927/H4668B3D.
Recent Nearby Earthquakes
Magnitude 3.0 and greater| Date | Time | Magnitude | Distance | Depth | Location | Link |
|---|---|---|---|---|---|---|
| 9/8/11 | 12:02 PM | 4.2 | 33.5 km | 6,000 m | Germany | usgs.gov |
| 7/23/09 | 7:58 PM | 4.1 | 41.9 km | 5,000 m | Germany | usgs.gov |
| 12/25/08 | 5:53 AM | 3.2 | 45.6 km | 1,000 m | Germany | usgs.gov |
| 12/9/08 | 7:28 PM | 3.3 | 29.2 km | 10,000 m | Germany | usgs.gov |
| 11/21/08 | 11:41 PM | 3.3 | 49.3 km | 1,000 m | Germany | usgs.gov |
| 11/12/08 | 12:56 PM | 3.4 | 50.6 km | 1,000 m | Germany | usgs.gov |
| 9/18/08 | 7:33 AM | 3.2 | 33.4 km | 1,000 m | Germany | usgs.gov |
| 5/13/08 | 2:55 AM | 3.3 | 41.2 km | 1,000 m | Germany | usgs.gov |
| 5/1/08 | 11:54 PM | 3.1 | 41.7 km | 1,000 m | Germany | usgs.gov |
| 4/23/08 | 5:10 AM | 3.1 | 42.3 km | 1,000 m | Germany | usgs.gov |
Find historical earthquake occurrences near Ulft, Gelderland
Earliest Date Latest Date
Magnitude 3.0 and greater Magnitude 4.0 and greater Magnitude 5.0 and greater

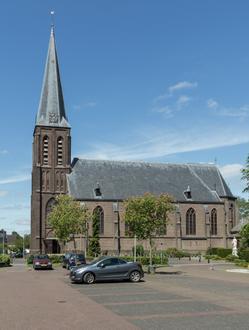
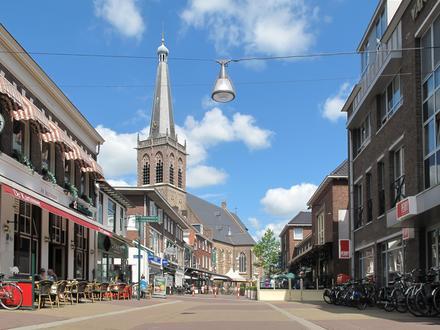
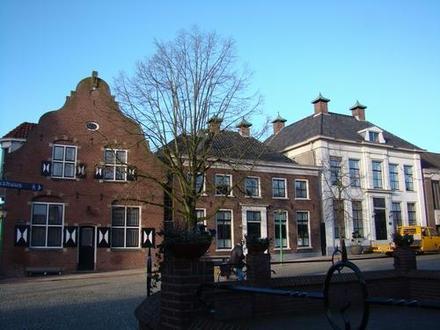
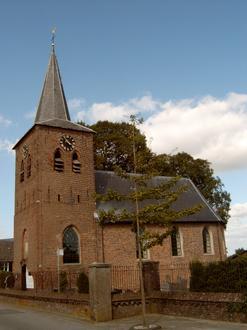
Ulft, Gelderland
Ulft is a town in Oude IJsselstreek in the Achterhoek area in the province of Gelderland, Netherlands. town has over 10.700 inhabitants and is the biggest town in the municipality Oude IJsselstreek. Until 1 January 2005, Ulft was part of the municip.. Ulft Wikipedia Page
About Our Data
The data on this page is estimated using a number of publicly available tools and resources. It is provided without warranty, and could contain inaccuracies. Use at your own risk. See here for more information.