Businesses in Ulvenhout
Hotels & Travel
Restaurants
Automotive
Financial Services
Medical
Beauty & Spas
Community & Government
Industries
Business Distribution by Industry Professional Services: 23.9%
Shopping: 14.5%
Industry: 9.5%
Medical: 8%
Home Services: 7.7%
Other: 36.4%
| Industry Description | Number of Establishments | Average Google Rating | Businesses per 1,000 residents |
|---|---|---|---|
| Beauty salons | 17 | 4.4 | 3.4 |
| Loan companies | 16 | 3.0 | 3.2 |
| General contractors | 15 | 3.6 | 3.0 |
| Other construction | 14 | 4.0 | 2.8 |
| Dentists | 9 | 3.0 | 1.8 |
| Health and medical | 54 | 3.9 | 10.9 |
| Accountants | 14 | 2.8 | |
| Corporate management | 23 | 4.4 | 4.7 |
| Lawyers legal | 9 | 3.4 | 1.8 |
| Area of Ulvenhout, North Brabant | 5.2 km² |
| Population | 4,940 |
| Male Population | 2,405 (48.7%) |
| Female Population | 2,535 (51.3%) |
| Population change from 1975 to 2015 | +28.7% |
| Population change from 2000 to 2015 | +9.9% |
| Median Age | 39.6 |
| Male Median Age | 39.1 |
| Female Median Age | 40.1 |
| Area Codes | 76 |
| Neighborhoods | Ulvenhout |
| Local Time | Thursday 5:33 AM |
| Timezone | Central European Summer Time |
| Lat & Lng | 51.54907° / 4.79931° |
| Postal Codes | 4851 |
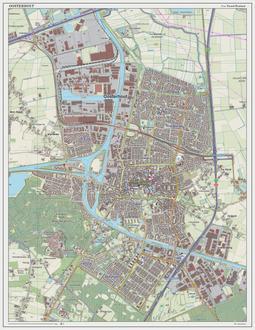
Ulvenhout, North Brabant - Map
Ulvenhout, North Brabant Population
Years 1975 to 2015| Data | 1975 | 1990 | 2000 | 2015 |
|---|---|---|---|---|
| Population | 3,839 | 4,100 | 4,496 | 4,940 |
| Population Density | 735.3 / km² | 785.3 / km² | 861.1 / km² | 946.2 / km² |
Ulvenhout Population change from 2000 to 2015
Increase of 9.9% from year 2000 to 2015| Location | Change since 1975 | Change since 1990 | Change since 2000 |
|---|---|---|---|
| Ulvenhout, North Brabant | +28.7% | +20.5% | +9.9% |
| Noord-Brabant | +21.7% | +11.4% | +5.1% |
| Netherlands | +24.3% | +13.4% | +6.5% |
Ulvenhout, North Brabant Median Age
Median Age: 39.6 years| Location | Median Age | Median Age (Female) | Median Age (Male) |
|---|---|---|---|
| Ulvenhout, North Brabant | 39.6 years | 40.1 years | 39.1 years |
| Noord-Brabant | 41.8 years | 42.5 years | 41.1 years |
| Netherlands | 41 years | 41.7 years | 40.2 years |
Ulvenhout, North Brabant Population Tree
Population By Age and Gender| Age | Male | Female | Total |
|---|---|---|---|
| Under 5 | 140 | 139 | 280 |
| 5-9 | 144 | 136 | 280 |
| 10-14 | 136 | 135 | 271 |
| 15-19 | 145 | 153 | 299 |
| 20-24 | 169 | 193 | 363 |
| 25-29 | 165 | 173 | 338 |
| 30-34 | 162 | 165 | 328 |
| 35-39 | 172 | 168 | 341 |
| 40-44 | 190 | 187 | 377 |
| 45-49 | 185 | 180 | 365 |
| 50-54 | 164 | 164 | 328 |
| 55-59 | 151 | 149 | 300 |
| 60-64 | 150 | 149 | 299 |
| 65-69 | 110 | 118 | 228 |
| 70-74 | 89 | 97 | 186 |
| 75-79 | 66 | 85 | 152 |
| 80-84 | 42 | 72 | 115 |
| 85 Plus | 27 | 69 | 97 |
Ulvenhout, North Brabant Population Density
Population Density: 946.2 / km²| Location | Population | Area | Population Density |
|---|---|---|---|
| Ulvenhout, North Brabant | 4,940 | 5.2 km² | 946.2 / km² |
| Noord-Brabant | 2.5 million | 5,084.3 km² | 488.9 / km² |
| Netherlands | 16.9 million | 41,398.3 km² | 408.7 / km² |
Ulvenhout, North Brabant Historical and Projected Population
Estimated Population from 1300 to 2100Sources:
1. JRC (European Commission's Joint Research Centre) work on the GHS built-up grid
2. CIESIN (Center for International Earth Science Information Network)
3. [Link] Klein Goldewijk, K., Beusen, A., Doelman, J., and Stehfest, E.: Anthropogenic land use estimates for the Holocene – HYDE 3.2, Earth Syst. Sci. Data, 9, 927–953, https://doi.org/10.5194/essd-9-927-2017, 2017.
Area Codes
Percentage Area Codes used by businesses in Ulvenhout Area Code 76: 76.1%
Area Code 6: 19.1%
Other: 4.8%
Business distribution by price for Ulvenhout, North Brabant
Moderate: 55.6%
Inexpensive: 27.8%
Expensive: 16.7%
Human Development Index (HDI)
Statistic composite index of life expectancy, education, and per capita income.Sources: [Link] Kummu, M., Taka, M. & Guillaume, J. Gridded global datasets for Gross Domestic Product and Human Development Index over 1990–2015. Sci Data 5, 180004 (2018) doi:10.1038/sdata.2018.4
Ulvenhout, North Brabant CO2 Emissions
Carbon Dioxide (CO2) Emissions Per Capita in Tonnes Per Year| Location | CO2 Emissions | CO2 Emissions Per Capita | CO2 Emissions Intensity |
|---|---|---|---|
| Ulvenhout, North Brabant | 58,181 tn | 11.8 tn | 11,143 tons/km² |
| Noord-Brabant | 28,800,645 tn | 11.6 tn | 5,664 tons/km² |
| Netherlands | 167,743,567 tn | 9.91 tn | 4,051 tons/km² |
Ulvenhout, North Brabant CO2 Emissions
| 2013 CO2 emissions (tonnes/year) | 58,181 tn |
| 2013 CO2 emissions (tonnes/year) per capita | 11.8 tn |
| 2013 CO2 emissions intensity (tonnes/km²/year) | 11,143 tons/km² |
Recent Nearby Earthquakes
Magnitude 3.0 and greater| Date | Time | Magnitude | Distance | Depth | Location | Link |
|---|---|---|---|---|---|---|
| 9/8/11 | 12:02 PM | 4.2 | 86.2 km | 6,000 m | Germany | usgs.gov |
| 11/28/06 | 12:19 AM | 3.1 | 93.6 km | 4,000 m | The Netherlands | usgs.gov |
| 11/9/01 | 4:43 PM | 3.2 | 88 km | 10,000 m | Belgium | usgs.gov |
| 6/22/01 | 6:53 PM | 4 | 99 km | 10,000 m | Belgium | usgs.gov |
| 6/22/01 | 6:39 PM | 4.8 | 82.7 km | 10,000 m | Belgium | usgs.gov |
| 2/16/01 | 4:54 PM | 3.2 | 82.9 km | 5,000 m | Belgium | usgs.gov |
| 9/11/99 | 5:32 AM | 3.7 | 54.9 km | 10,000 m | The Netherlands | usgs.gov |
| 6/11/93 | 10:04 AM | 3.3 | 63.1 km | 10,000 m | Belgium | usgs.gov |
| 6/3/93 | 5:57 AM | 3.8 | 83.1 km | 10,000 m | Belgium | usgs.gov |
| 2/15/93 | 2:46 AM | 3.4 | 84.2 km | 10,000 m | Belgium | usgs.gov |
Find historical earthquake occurrences near Ulvenhout, North Brabant
Earliest Date Latest Date
Magnitude 3.0 and greater Magnitude 4.0 and greater Magnitude 5.0 and greater

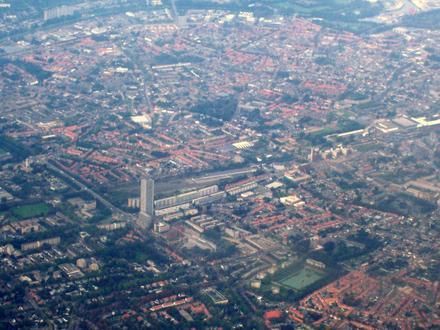
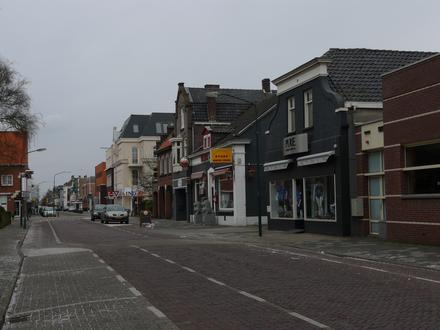
Ulvenhout, North Brabant
Ulvenhout is a village in the Dutch province of North Brabant. It is located in the municipality of Breda. The part south of the A58 motorway came to the municipality of Alphen-Chaam and is called Ulvenhout Media related to Ulvenhout at Wikimedia Ulvenhout Wikipedia Page

About Our Data
The data on this page is estimated using a number of publicly available tools and resources. It is provided without warranty, and could contain inaccuracies. Use at your own risk. See here for more information.