Businesses in Zawoja
Hotels & Travel
Restaurants
Automotive
Financial Services
Medical
Beauty & Spas
Community & Government
Industries
Business Distribution by Industry Hotels & Travel: 26.4%
Industry: 16.4%
Home Services: 12.1%
Shopping: 11.1%
Restaurants: 5.2%
Other: 28.8%
| Industry Description | Number of Establishments | Average Google Rating | Businesses per 1,000 residents |
|---|---|---|---|
| Grocery stores and supermarkets | 10 | 4.1 | 1.1 |
| Construction of houses | 10 | 4.6 | 1.1 |
| General contractors | 7 | 5.0 | 0.8 |
| Bed and breakfasts | 7 | 4.4 | 0.8 |
| Holiday homes, cabins and resorts | 16 | 4.2 | 1.8 |
| Hostels | 5 | 4.3 | 0.6 |
| Hotels and motels | 6 | 4.4 | 0.7 |
| Other accommodation | 62 | 4.3 | 6.8 |
| Travel agencies | 10 | 4.3 | 1.1 |
| Public parks | 16 | 4.8 | 1.8 |
| Area of Zawoja, Lesser Poland Voivodeship | 128.4 km² |
| Population | 9,061 |
| Male Population | 4,716 (52%) |
| Female Population | 4,345 (48%) |
| Population change from 1975 to 2015 | +34.7% |
| Population change from 2000 to 2015 | +5.4% |
| Median Age | 32.7 |
| Male Median Age | 32.3 |
| Female Median Age | 33.1 |
| Area Codes | 33 |
| Neighborhoods | Centrum, Przysłop, Wełcza, Zawoja |
| Local Time | Wednesday 1:24 PM |
| Timezone | Central European Summer Time |
| Lat & Lng | 49.64396° / 19.54227° |
| Postal Codes | 34-223 |
Zawoja, Lesser Poland Voivodeship - Map
Zawoja, Lesser Poland Voivodeship Population
Years 1975 to 2015| Data | 1975 | 1990 | 2000 | 2015 |
|---|---|---|---|---|
| Population | 6,726 | 8,148 | 8,599 | 9,061 |
| Population Density | 52.4 / km² | 63.4 / km² | 66.9 / km² | 70.5 / km² |
Zawoja Population change from 2000 to 2015
Increase of 5.4% from year 2000 to 2015| Location | Change since 1975 | Change since 1990 | Change since 2000 |
|---|---|---|---|
| Zawoja, Lesser Poland Voivodeship | +34.7% | +11.2% | +5.4% |
| Lesser Poland Voivodeship | +24.2% | +6.6% | +3.2% |
| Poland | +13% | +1.1% | +0.3% |
Zawoja, Lesser Poland Voivodeship Median Age
Median Age: 32.7 years| Location | Median Age | Median Age (Female) | Median Age (Male) |
|---|---|---|---|
| Zawoja, Lesser Poland Voivodeship | 32.7 years | 33.1 years | 32.3 years |
| Lesser Poland Voivodeship | 33.8 years | 34.3 years | 33.2 years |
| Poland | 35 years | 35.6 years | 34.3 years |
Zawoja, Lesser Poland Voivodeship Population Tree
Population By Age and Gender| Age | Male | Female | Total |
|---|---|---|---|
| Under 5 | 336 | 298 | 634 |
| 5-9 | 324 | 284 | 608 |
| 10-14 | 327 | 314 | 641 |
| 15-19 | 383 | 328 | 712 |
| 20-24 | 387 | 353 | 741 |
| 25-29 | 430 | 372 | 803 |
| 30-34 | 373 | 358 | 731 |
| 35-39 | 348 | 378 | 726 |
| 40-44 | 370 | 295 | 666 |
| 45-49 | 352 | 292 | 645 |
| 50-54 | 348 | 305 | 654 |
| 55-59 | 317 | 314 | 631 |
| 60-64 | 274 | 269 | 544 |
| 65-69 | 145 | 184 | 329 |
| 70-74 | 0 | 1 | 2 |
| 75-79 | 0 | 1 | 1 |
| 80-84 | 0 | 1 | 1 |
| 85 Plus | 0 | 0 | 1 |
Zawoja, Lesser Poland Voivodeship Population Density
Population Density: 70.5 / km²| Location | Population | Area | Population Density |
|---|---|---|---|
| Zawoja, Lesser Poland Voivodeship | 9,061 | 128.4 km² | 70.5 / km² |
| Lesser Poland Voivodeship | 3.4 million | 15,196.3 km² | 221.5 / km² |
| Poland | 38.5 million | 312,592.3 km² | 123.3 / km² |
Zawoja, Lesser Poland Voivodeship Historical Population
Estimated Ancient Population until 2015Sources:
1. JRC (European Commission's Joint Research Centre) work on the GHS built-up grid
2. CIESIN (Center for International Earth Science Information Network)
3. [Link] Klein Goldewijk, K., Beusen, A., Doelman, J., and Stehfest, E.: Anthropogenic land use estimates for the Holocene – HYDE 3.2, Earth Syst. Sci. Data, 9, 927–953, https://doi.org/10.5194/essd-9-927-2017, 2017.
Neighborhoods
Business Distribution by neighborhood in Zawoja Zawoja: 60.2%
Centrum: 21.4%
Przysłop: 7.1%
Wełcza: 6.1%
Other: 5.1%
Area Codes
Percentage Area Codes used by businesses in Zawoja Area Code 33: 47.9%
Area Code 50: 12.3%
Area Code 60: 11.4%
Area Code 66: 5.7%
Other: 22.7%
Business distribution by price for Zawoja, Lesser Poland Voivodeship
Moderate: 61.5%
Inexpensive: 30.8%
Expensive: 7.7%
Human Development Index (HDI)
Statistic composite index of life expectancy, education, and per capita income.Sources: [Link] Kummu, M., Taka, M. & Guillaume, J. Gridded global datasets for Gross Domestic Product and Human Development Index over 1990–2015. Sci Data 5, 180004 (2018) doi:10.1038/sdata.2018.4
Zawoja, Lesser Poland Voivodeship CO2 Emissions
Carbon Dioxide (CO2) Emissions Per Capita in Tonnes Per Year| Location | CO2 Emissions | CO2 Emissions Per Capita | CO2 Emissions Intensity |
|---|---|---|---|
| Zawoja, Lesser Poland Voivodeship | 54,608 tn | 6.03 tn | 425.1 tons/km² |
| Lesser Poland Voivodeship | 19,975,109 tn | 5.93 tn | 1,314 tons/km² |
| Poland | 230,825,573 tn | 5.99 tn | 738.4 tons/km² |
Zawoja, Lesser Poland Voivodeship CO2 Emissions
| 2013 CO2 emissions (tonnes/year) | 54,608 tn |
| 2013 CO2 emissions (tonnes/year) per capita | 6.03 tn |
| 2013 CO2 emissions intensity (tonnes/km²/year) | 425.1 tons/km² |
Natural Hazards Risk
Relative risk out of 10| Flood | High (7) |
| Earthquake | Low (2) |
* Risk, particularly concerning flood or landslide, may not be for the entire area.
Sources: 1. Dilley, M., R.S. Chen, U. Deichmann, A.L. Lerner-Lam, M. Arnold, J. Agwe, P. Buys, O. Kjekstad, B. Lyon, and G. Yetman. 2005. Natural Disaster Hotspots: A Global Risk Analysis. Washington, D.C.: World Bank. https://doi.org/10.1596/0-8213-5930-4.
2. Center for Hazards and Risk Research - CHRR - Columbia University, Center for International Earth Science Information Network - CIESIN - Columbia University. 2005. Global Flood Hazard Frequency and Distribution. Palisades, NY: NASA Socioeconomic Data and Applications Center (SEDAC). https://doi.org/10.7927/H4668B3D.
3. Center for Hazards and Risk Research - CHRR - Columbia University, Center for International Earth Science Information Network - CIESIN - Columbia University. 2005. Global Earthquake Hazard Distribution - Peak Ground Acceleration. Palisades, NY: NASA Socioeconomic Data and Applications Center (SEDAC). https://doi.org/10.7927/H4BZ63ZS.
Recent Nearby Earthquakes
Magnitude 3.0 and greater| Date | Time | Magnitude | Distance | Depth | Location | Link |
|---|---|---|---|---|---|---|
| 11/17/15 | 3:28 PM | 4.1 | 58.8 km | 6,060 m | 3km N of Chelmek, Poland | usgs.gov |
| 11/18/08 | 4:45 PM | 3.2 | 69.8 km | 1,000 m | Poland | usgs.gov |
| 2/14/08 | 7:49 AM | 3.1 | 76.6 km | 5,000 m | Poland | usgs.gov |
| 12/15/06 | 6:30 PM | 3.2 | 68.1 km | 5,000 m | Poland | usgs.gov |
| 6/24/06 | 6:12 PM | 3.1 | 60.5 km | 5,000 m | Slovakia | usgs.gov |
| 12/18/05 | 6:32 PM | 3.2 | 72.9 km | 1,000 m | Poland | usgs.gov |
| 6/28/05 | 5:35 AM | 3.3 | 55 km | 5,000 m | Poland | usgs.gov |
| 1/29/05 | 9:16 AM | 3.6 | 31.1 km | 5,000 m | Poland-Slovakia border region | usgs.gov |
| 12/8/04 | 5:09 PM | 3.4 | 35.6 km | 5,000 m | Poland-Slovakia border region | usgs.gov |
| 12/2/04 | 10:25 AM | 4.2 | 32.4 km | 5,000 m | Poland-Slovakia border region | usgs.gov |
Find historical earthquake occurrences near Zawoja, Lesser Poland Voivodeship
Earliest Date Latest Date
Magnitude 3.0 and greater Magnitude 4.0 and greater Magnitude 5.0 and greater

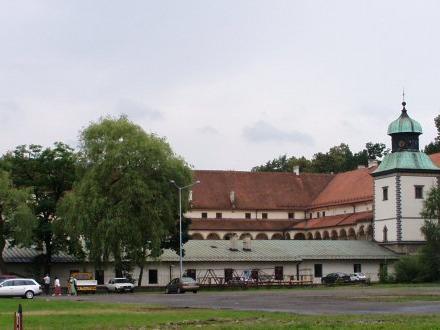
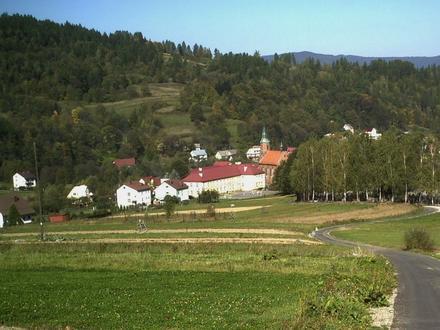
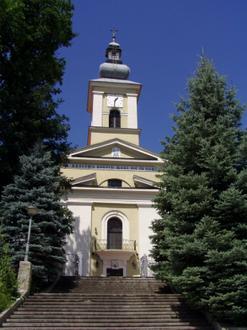
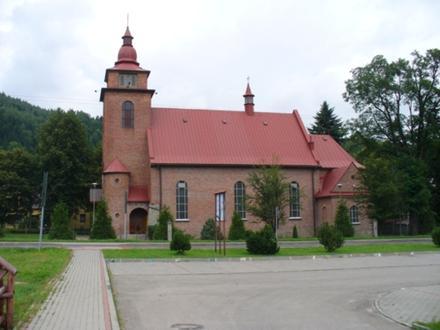
Zawoja, Lesser Poland Voivodeship
Zawoja [zaˈvɔja] is a village in Southern Poland located close to Maków Podhalański. It is situated in Sucha County (Lesser Poland Voivodeship). With neighbouring village of Skawica it constitutes a rural Zawoja Commune. It has 6,200 inhabitants (200.. Zawoja Wikipedia Page
Postal Codes
Percentage of businesses by Postal Codes in Zawoja Postal Code 34-222: 85.7%
Postal Code 34-223: 12.6%
Other: 1.8%
About Our Data
The data on this page is estimated using a number of publicly available tools and resources. It is provided without warranty, and could contain inaccuracies. Use at your own risk. See here for more information.