Businesses in Gislaved
Hotels & Travel
Restaurants
Automotive
Financial Services
Medical
Beauty & Spas
Community & Government
Industries
Business Distribution by Industry Industry: 24.6%
Shopping: 15.6%
Professional Services: 11.4%
Home Services: 8.1%
Automotive: 6.4%
Other: 33.8%
| Industry Description | Number of Establishments | Average Age of Business | Average Google Rating | Businesses per 1,000 residents |
|---|---|---|---|---|
| Car parts | 12 | 4.2 | 1.6 | |
| Car repair | 15 | 4.0 | 1.9 | |
| Gas stations | 12 | 3.8 | 1.6 | |
| Beauty salons | 12 | 4.6 | 1.6 | |
| Hairdressers | 7 | 4.6 | 0.9 | |
| Preschools and kindergartens | 10 | 4.0 | 1.3 | |
| Creative arts | 7 | 4.3 | 0.9 | |
| Grocery stores and supermarkets | 12 | 4.1 | 1.6 | |
| General contractors | 9 | 4.0 | 1.2 | |
| Other construction | 5 | 3.8 | 0.6 | |
| Real estate | 10 | 45.5 years | 3.8 | 1.3 |
| Construction of buildings | 15 | 28.5 years | 4.0 | 1.9 |
| Other membership organizations | 11 | 39.3 years | 3.9 | 1.4 |
| Wholesale of construction supplies | 6 | 4.5 | 0.8 | |
| Wholesale of machinery | 27 | 31.9 years | 3.7 | 3.5 |
| Wholesalers | 39 | 41.3 years | 4.2 | 5.1 |
| Corporate management | 15 | 26.2 years | 3.9 | 1.9 |
| Churches | 8 | 3.7 | 1.0 | |
| Clothing accessories | 5 | 4.2 | 0.6 | |
| Clothing stores | 8 | 4.0 | 1.0 | |
| Department stores | 8 | 31.7 years | 3.9 | 1.0 |
| Electronics stores | 9 | 31 years | 3.7 | 1.2 |
| Furniture stores | 8 | 4.1 | 1.0 | |
| Hardware stores | 8 | 3.8 | 1.0 | |
| Household appliances and goods | 9 | 27.3 years | 4.3 | 1.2 |
| Shopping other | 15 | 29.9 years | 4.4 | 1.9 |
| Area of Gislaved, Jönköping County | 6.5 km² |
| Population | 7,719 |
| Male Population | 3,852 (49.9%) |
| Female Population | 3,867 (50.1%) |
| Population change from 1975 to 2015 | -35.4% |
| Population change from 2000 to 2015 | -12% |
| Median Age | 41.6 |
| Male Median Age | 41 |
| Female Median Age | 42.1 |
| Area Codes | 371 |
| Local Time | Friday 4:54 AM |
| Timezone | Central European Summer Time |
| Lat & Lng | 57.3044° / 13.54078° |
| Postal Codes | 330 26, 332 01, 332 20, 332 21, 332 22, More |
Gislaved, Jönköping County - Map
Gislaved, Jönköping County Population
Years 1975 to 2015| Data | 1975 | 1990 | 2000 | 2015 |
|---|---|---|---|---|
| Population | 11,941 | 10,115 | 8,768 | 7,719 |
| Population Density | 1,842 / km² | 1,560 / km² | 1,353 / km² | 1,191 / km² |
Gislaved Population change from 2000 to 2015
Decrease of 12% from year 2000 to 2015| Location | Change since 1975 | Change since 1990 | Change since 2000 |
|---|---|---|---|
| Gislaved, Jönköping County | -35.4% | -23.7% | -12% |
| Jonkoping | +4.3% | +4.4% | +4.1% |
| Sweden | +19.2% | +14.2% | +10.2% |
Gislaved, Jönköping County Median Age
Median Age: 41.6 years| Location | Median Age | Median Age (Female) | Median Age (Male) |
|---|---|---|---|
| Gislaved, Jönköping County | 41.6 years | 42.1 years | 41 years |
| Jonkoping | 41.3 years | 42.3 years | 40.2 years |
| Sweden | 40.8 years | 41.8 years | 39.8 years |
Gislaved, Jönköping County Population Tree
Population By Age and Gender| Age | Male | Female | Total |
|---|---|---|---|
| Under 5 | 215 | 219 | 435 |
| 5-9 | 230 | 221 | 451 |
| 10-14 | 229 | 239 | 469 |
| 15-19 | 301 | 294 | 596 |
| 20-24 | 246 | 220 | 466 |
| 25-29 | 193 | 178 | 372 |
| 30-34 | 200 | 191 | 392 |
| 35-39 | 252 | 258 | 510 |
| 40-44 | 295 | 274 | 569 |
| 45-49 | 299 | 289 | 588 |
| 50-54 | 263 | 231 | 494 |
| 55-59 | 239 | 237 | 477 |
| 60-64 | 251 | 238 | 490 |
| 65-69 | 222 | 208 | 430 |
| 70-74 | 143 | 161 | 305 |
| 75-79 | 113 | 145 | 258 |
| 80-84 | 85 | 121 | 206 |
| 85 Plus | 77 | 143 | 221 |
Gislaved, Jönköping County Population Density
Population Density: 1,191 / km²| Location | Population | Area | Population Density |
|---|---|---|---|
| Gislaved, Jönköping County | 7,719 | 6.5 km² | 1,191 / km² |
| Jonkoping | 342,162 | 11,745.5 km² | 29.1 / km² |
| Sweden | 9.6 million | 449,151.6 km² | 21.3 / km² |
Area Codes
Percentage Area Codes used by businesses in Gislaved Area Code 371: 78.6%
Area Code 70: 8.5%
Other: 13%
Business distribution by price for Gislaved, Jönköping County
Inexpensive: 68.4%
Moderate: 26.3%
Expensive: 5.3%
Human Development Index (HDI)
Statistic composite index of life expectancy, education, and per capita income.Sources: [Link] Kummu, M., Taka, M. & Guillaume, J. Gridded global datasets for Gross Domestic Product and Human Development Index over 1990–2015. Sci Data 5, 180004 (2018) doi:10.1038/sdata.2018.4
Gislaved, Jönköping County CO2 Emissions
Carbon Dioxide (CO2) Emissions Per Capita in Tonnes Per Year| Location | CO2 Emissions | CO2 Emissions Per Capita | CO2 Emissions Intensity |
|---|---|---|---|
| Gislaved, Jönköping County | 75,617 tn | 9.8 tn | 11,669 tons/km² |
| Jonkoping | 3,383,179 tn | 9.89 tn | 288 tons/km² |
| Sweden | 93,354,240 tn | 9.75 tn | 207.8 tons/km² |
Gislaved, Jönköping County CO2 Emissions
| 2013 CO2 emissions (tonnes/year) | 75,617 tn |
| 2013 CO2 emissions (tonnes/year) per capita | 9.8 tn |
| 2013 CO2 emissions intensity (tonnes/km²/year) | 11,669 tons/km² |

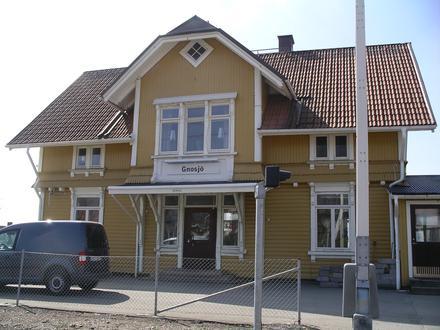
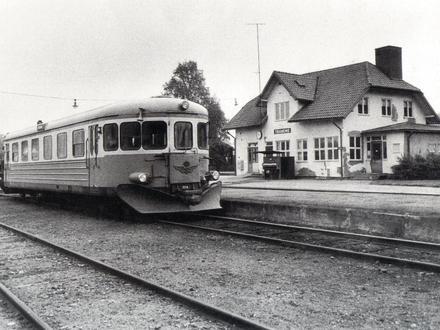
Gislaved, Jönköping County
Gislaved is a locality and the seat of Gislaved Municipality, Jönköping County, Sweden with 10,037 inhabitants in 2010, out of a municipal total of nearly 30,000. Gislaved Wikipedia Page
Postal Codes
Percentage of businesses by Postal Codes in Gislaved Postal Code 332 30: 32.9%
Postal Code 332 35: 15.3%
Postal Code 332 33: 15%
Postal Code 332 36: 14.1%
Postal Code 332 32: 5.3%
Other: 17.4%
About Our Data
The data on this page is estimated using a number of publicly available tools and resources. It is provided without warranty, and could contain inaccuracies. Use at your own risk. See here for more information.