- World
- »
- TZ
- »
- Tanga, Tanzania
Businesses in Tanga, Tanzania
Hotels & Travel
Restaurants
Automotive
Financial Services
Medical
Beauty & Spas
Community & Government
Industries
Business Distribution by Industry Shopping: 17.8%
Hotels & Travel: 15.1%
Education: 10.2%
Industry: 10%
Restaurants: 7.4%
Automotive: 6.5%
Religion: 5.4%
Professional Services: 5%
Other: 22.7%
| Industry Description | Number of Establishments | Average Google Rating | Businesses per 1,000 residents |
|---|---|---|---|
| Gas stations | 6 | 3.8 | 0.0 |
| Higher education (colleges and universities) | 5 | 4.0 | 0.0 |
| Secondary education | 7 | 4.0 | 0.0 |
| Loan companies | 6 | 4.0 | 0.0 |
| Holiday homes, cabins and resorts | 5 | 4.1 | 0.0 |
| Hotels and motels | 21 | 4.0 | 0.1 |
| Other accommodation | 15 | 4.0 | 0.0 |
| Hospitals | 8 | 4.1 | 0.0 |
| Churches | 7 | 3.9 | 0.0 |
| Mosques | 8 | 4.4 | 0.0 |
| Department stores | 6 | 3.5 | 0.0 |
| Pharmacies and drug stores | 17 | 4.0 | 0.1 |
| Area of Tanga, Tanzania | 536 km² |
| Population | 304,735 |
| Male Population | 146,091 (47.9%) |
| Female Population | 158,645 (52.1%) |
| Population change from 1975 to 2015 | +103.9% |
| Population change from 2000 to 2015 | +25.9% |
| Median Age | 21.4 |
| Male Median Age | 21 |
| Female Median Age | 21.7 |
| Area Codes | 27 |
| Neighborhoods | Bombo, Central, Ngamiani, Raskazone |
| Local Time | Sunday 2:32 PM |
| Timezone | East Africa Time |
| Lat & Lng | -5.06893° / 39.09875° |
Tanga, Tanzania - Map
Tanga, Tanzania Population
Years 1975 to 2015| Data | 1975 | 1990 | 2000 | 2015 |
|---|---|---|---|---|
| Population | 149,479 | 204,865 | 242,053 | 304,735 |
| Population Density | 278.9 / km² | 382.2 / km² | 451.6 / km² | 568.5 / km² |
Tanga, Tanzania Population change from 2000 to 2015
Increase of 25.9% from year 2000 to 2015| Location | Change since 1975 | Change since 1990 | Change since 2000 |
|---|---|---|---|
| Tanga, Tanzania | +103.9% | +48.7% | +25.9% |
| Tanga Region | +192.5% | +90.6% | +47.8% |
| Tanzania | +234.9% | +110.2% | +57.4% |
Tanga, Tanzania Median Age
Median Age: 21.4 years| Location | Median Age | Median Age (Female) | Median Age (Male) |
|---|---|---|---|
| Tanga, Tanzania | 21.4 years | 21.7 years | 21 years |
| Tanga Region | 18.1 years | 19 years | 17.2 years |
| Tanzania | 17.7 years | 18.2 years | 17.1 years |
Tanga, Tanzania Population Tree
Population By Age and Gender| Age | Male | Female | Total |
|---|---|---|---|
| Under 5 | 17,965 | 17,707 | 35,672 |
| 5-9 | 17,870 | 18,011 | 35,882 |
| 10-14 | 17,884 | 19,075 | 36,959 |
| 15-19 | 16,601 | 18,852 | 35,453 |
| 20-24 | 14,160 | 17,195 | 31,356 |
| 25-29 | 11,662 | 15,278 | 26,940 |
| 30-34 | 10,560 | 12,808 | 23,368 |
| 35-39 | 9,014 | 10,313 | 19,328 |
| 40-44 | 7,624 | 7,861 | 15,486 |
| 45-49 | 5,553 | 8,078 | 13,631 |
| 50-54 | 5,372 | 4,219 | 9,591 |
| 55-59 | 3,640 | 2,730 | 6,371 |
| 60-64 | 3,504 | 2,488 | 5,992 |
| 65-69 | 1,849 | 1,568 | 3,417 |
| 70-74 | 1,817 | 1,657 | 3,474 |
| 75-79 | 1,016 | 806 | 1,823 |
| 80-84 | 0 | 0 | 0 |
| 85 Plus | 0 | 0 | 0 |
Tanga, Tanzania Population Density
Population Density: 568.5 / km²| Location | Population | Area | Population Density |
|---|---|---|---|
| Tanga, Tanzania | 304,735 | 536 km² | 568.5 / km² |
| Tanga Region | 2.4 million | 27,889.3 km² | 85.3 / km² |
| Tanzania | 53.2 million | 940,193.6 km² | 56.6 / km² |
Tanga, Tanzania Historical and Projected Population
Estimated Population from 1600 to 2100Sources:
1. JRC (European Commission's Joint Research Centre) work on the GHS built-up grid
2. CIESIN (Center for International Earth Science Information Network)
3. [Link] Klein Goldewijk, K., Beusen, A., Doelman, J., and Stehfest, E.: Anthropogenic land use estimates for the Holocene – HYDE 3.2, Earth Syst. Sci. Data, 9, 927–953, https://doi.org/10.5194/essd-9-927-2017, 2017.
Neighborhoods
Business Distribution by neighborhood in Tanga, Tanzania Central: 54.7%
Ngamiani: 23.4%
Raskazone: 10.2%
Bombo: 9.5%
Other: 2.2%
Area Codes
Percentage Area Codes used by businesses in Tanga, Tanzania Area Code 27: 33%
Area Code 71: 24.8%
Area Code 78: 14.7%
Area Code 65: 7.3%
Area Code 76: 7.3%
Other: 12.8%
Business distribution by price for Tanga, Tanzania
Moderate: 41.2%
Inexpensive: 32.4%
Expensive: 23.5%
Very Expensive: 2.9%
Human Development Index (HDI)
Statistic composite index of life expectancy, education, and per capita income.Sources: [Link] Kummu, M., Taka, M. & Guillaume, J. Gridded global datasets for Gross Domestic Product and Human Development Index over 1990–2015. Sci Data 5, 180004 (2018) doi:10.1038/sdata.2018.4
Tanga, Tanzania CO2 Emissions
Carbon Dioxide (CO2) Emissions Per Capita in Tonnes Per Year| Location | CO2 Emissions | CO2 Emissions Per Capita | CO2 Emissions Intensity |
|---|---|---|---|
| Tanga, Tanzania | 82,297 tn | 0.27 tn | 153.5 tons/km² |
| Tanga Region | 648,127 tn | 0.27 tn | 23.2 tons/km² |
| Tanzania | 13,721,720 tn | 0.26 tn | 14.6 tons/km² |
Tanga, Tanzania CO2 Emissions
| 2013 CO2 emissions (tonnes/year) | 82,297 tn |
| 2013 CO2 emissions (tonnes/year) per capita | 0.27 tn |
| 2013 CO2 emissions intensity (tonnes/km²/year) | 153.5 tons/km² |
Natural Hazards Risk
Relative risk out of 10| Drought | Low (2) |
| Flood | High (10) |
* Risk, particularly concerning flood or landslide, may not be for the entire area.
Sources: 1. Dilley, M., R.S. Chen, U. Deichmann, A.L. Lerner-Lam, M. Arnold, J. Agwe, P. Buys, O. Kjekstad, B. Lyon, and G. Yetman. 2005. Natural Disaster Hotspots: A Global Risk Analysis. Washington, D.C.: World Bank. https://doi.org/10.1596/0-8213-5930-4.
2. Center for Hazards and Risk Research - CHRR - Columbia University, Center for International Earth Science Information Network - CIESIN - Columbia University, and International Research Institute for Climate and Society - IRI - Columbia University. 2005. Global Drought Hazard Frequency and Distribution. Palisades, NY: NASA Socioeconomic Data and Applications Center (SEDAC). https://doi.org/10.7927/H4VX0DFT.
3. Center for Hazards and Risk Research - CHRR - Columbia University, Center for International Earth Science Information Network - CIESIN - Columbia University. 2005. Global Flood Hazard Frequency and Distribution. Palisades, NY: NASA Socioeconomic Data and Applications Center (SEDAC). https://doi.org/10.7927/H4668B3D.
Recent Nearby Earthquakes
Magnitude 3.0 and greater
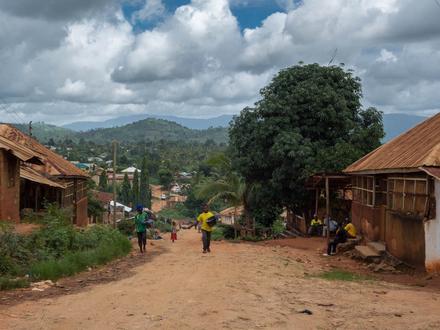
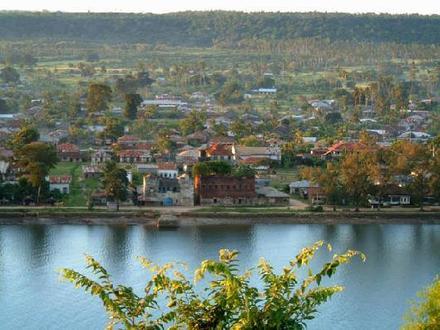
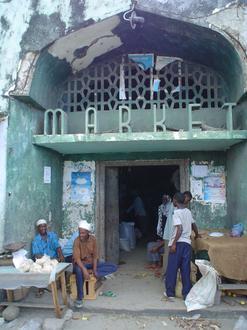
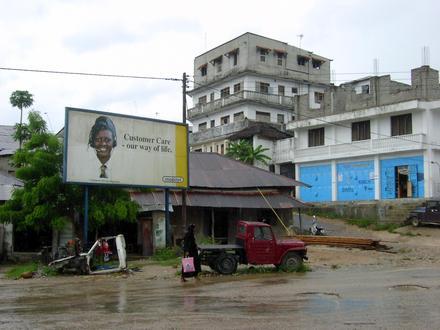
Tanga, Tanzania
Tanga is both the name of the most northerly seaport city of Tanzania, and the surrounding Tanga Region. It is the Regional Headquarters of the region. With a population of 243,580 in 2002, Tanga is one of the largest cities in the country. It is a q.. Tanga, Tanzania Wikipedia Page
About Our Data
The data on this page is estimated using a number of publicly available tools and resources. It is provided without warranty, and could contain inaccuracies. Use at your own risk. See here for more information.